
Introduction
In basic terms, an event-driven architecture (EDA) is a distributed system that involves moving data and events between microservices in an asynchronous manner with an event broker acting as the central nervous system in the overall architecture. It is a software design pattern in which decoupled applications can asynchronously publish and subscribe to events via an event broker.
In an increasingly event-driven world, enterprises are deploying more messaging middleware solutions comprising networks’ message broker nodes. These networks route event-related messages between applications in disparate physical locations, clouds, or even geographies. As the enterprises grow in size and maturity in their EDA deployment, it gets more and more challenging to diagnose problems simply by troubleshooting an error message or looking at a log. This is where distributed tracing comes to the rescue by providing system administrators with observability and the ability to trace the lifecycle of an event as it travels between microservices and different API calls and hops within event brokers through the entire event mesh—composed of a network of connected brokers located close to the publishers and subscribers.
Problem Statement
To achieve full observability in any system, there is one very important assumption that needs to be satisfied: every component in the system MUST be able to generate information about what’s happening with it and its interaction with other components. So, a transactional event that is composed of multiple hops between different systems and / or interfaces would require the release of trace information on every hop from every interface. A missing step in trace generation results in an incomplete picture in the lifecycle of the transactional event. Pretty straightforward. However, complexity knocks on the door when dealing with event brokers in an EDA system.
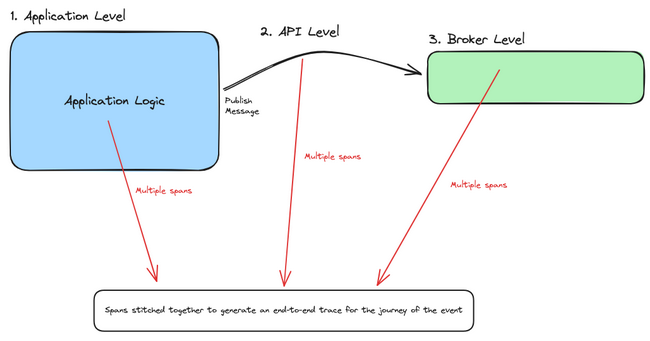
To understand why it’s complex to instrument event broker, let us take a look at the three levels at which traces can be collected in a distributed event-driven system:
- Application level: During business logic execution within the context of the microservice
- API level: During communication between other components and services, whether it is synchronous REST or an asynchronous event call
- Event broker level: At every hop inside the event mesh and inside the event broker
As the business evolves in both scale and routing sophistication, it becomes more critical to have visibility into exactly how messages are being processed by the underlying message brokering topology. Without observability at the broker / routing tier, here are some questions an enterprise cannot answer:
- Where are messages routed—point to point, across geographies and regions, or from on premises to cloud?
- Are messages processed successfully?
- How does message processing track against key metrics and performance indicators?
- Are messages delayed by insufficient resources?
- What type of messages end up in an error state due to misrouting, permissions, content, or lack of storage?
- How do messages get tracked against other business or regulatory requirements, e.g., geographical data sovereignty, data residency requirements, sensitive data exposure, and time to process?
Where Does OpenTelemetry Fit Within EDA Systems?
As the industry standard and vendor- and tool-agnostic framework for managing telemetry data, OpenTelemetry (OTel) is the de facto go-to for answering all observability-related questions in the overall architecture. And in the spirit of adding more observability to the system, EDA needs OTel to solve mysteries to answer the previous questions and get a better idea of where things went wrong or what needs to be improved within the path of the transactional event.
The OTel ecosystem has reached a high level of maturity for tools and processes that generate and collect trace information at the application and API levels. With that being said, there are still some gaps in the industry when it comes to collecting metrics from event brokers in event-driven systems on the event-broker level. As stated in the semantic conventions for messaging spans in the OTel documentation, messaging systems are not standardized, meaning there are vendor-specific customizations on how to deal with trace generation from within the system. The design of event broker technologies has not historically supported OTel natively within the broker, hence leaving the broker component in the EDA system as a “Black Box,” where the limits of instrumentation with a message broker are reached along the boundaries of the broker: message in and message out.
As mentioned previously, to achieve complete visibility in a distributed EDA system, every component needs to generate trace information to the OTel collector, including the message broker. To support tracing within the OTel collector and the broker, a dedicated receiver in the collector needs to translate messaging-specific activities to telemetry data. To demonstrate how the messaging component in an EDA system could be instrumented, I will use the Solace PubSub+ Event Broker as an example for the rest of the article.
Enabling Tracing on the Broker Level
The Solace PubSub+ Event Broker is an advanced event broker that enables real-time, high-performance messaging in an EDA system running in cloud, on-premises, and hybrid environments. In an effort to bridge the observability gap within the event broker in an EDA system, Solace has native support in the OTel Collector through a Solace receiver. As applications start publishing and consuming guaranteed messages to and from the event broker, spans are generated from the application and API level using OTel SDK libraries and from the broker reflecting every hop inside the broker and within the event mesh. Activities such as enqueuing from publishing, dequeuing from consuming, and acknowledgment will generate spans that the OTel collector consumes and processes.
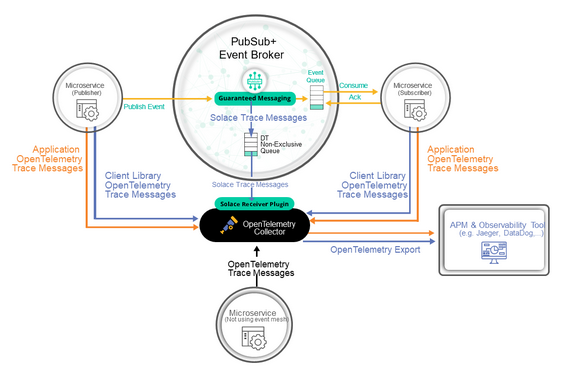
The above diagram shows the basic components of distributed tracing for a single event broker:
- Application client program
This is any piece of software that communicates with the Solace PubSub+ Event Broker via either the native element management protocol or via any of the standard messaging protocols within the supported languages and messaging protocols.
- Distributed tracing-enabled Solace PubSub+ Event Broker
The core event broker with an activated distributed tracing functionality.
- The Contrib distribution of the OpenTelemetry Collector
A version of the OTel Collector that contains the Solace receiver.
- OpenTelemetry-compliant observability backend
An observability tool / product that consumes OTel traces (e.g., Jaeger, DataDog, Dynatrace, etc.).
Thanks to the standardization of trace messages using the OTel Protocol (OTLP), after the spans are received by the Solace receiver on the OTel collector, they are processed to standardized OTel trace messages and passed to exporters. The exporter is a component in the collector that supports sending data to the backend observability system of choice. We can now get more visibility into the lifecycle of a transactional event in an EDA system as it propagates through the event broker(s) and the different queues within.
Note that once a single Solace PubSub+ Event Broker is configured for distributed tracing, this same configuration can be utilized for every event broker you connect within an event mesh.
Instrumenting Using an Agent: Auto-Instrumentation
For Java-based applications, it is common practice to dynamically inject telemetry information for any call an application does without the need to manually change business logic by simply running an agent alongside the application. This approach is known as automatic instrumentation and is used to capture telemetry information at the “edges” of a microservice. More details on how to download the Java agent can be found here.
After installing the Java agent, run the Solace producing application as follows:
java -javaagent:<absolute_path_to_the_jar_file>/opentelemetry-javaagent.jar \
-Dotel.javaagent.extensions=<absolute_path_to_the_jar_file>/solace-opentelemetry-jms-integration-1.1.0.jar \
-Dotel.propagators=solace_jms_tracecontext \
-Dotel.exporter.otlp.endpoint=http://localhost:4317 \
-Dotel.traces.exporter=otlp \
-Dotel.metrics.exporter=none \
-Dotel.instrumentation.jms.enabled=true \
-Dotel.resource.attributes=“service.name=SolaceJMSPublisher” \
-Dsolace.host=localhost:55557 \
-Dsolace.vpn=default \
-Dsolace.user=default \
-Dsolace.password=default \
-Dsolace.topic=solace/tracing \
-jar solace-publisher.jar
Similarly, run the consuming application as follows:
java -javaagent:<absolute_path_to_the_jar_file>/opentelemetry-javaagent.jar \
-Dotel.javaagent.extensions=<absolute_path_to_the_jar_file>/solace-opentelemetry-jms-integration-1.1.0.jar \
-Dotel.propagators=solace_jms_tracecontext \
-Dotel.traces.exporter=otlp \
-Dotel.metrics.exporter=none \
-Dotel.instrumentation.jms.enabled=true \
-Dotel.resource.attributes=“service.name=SolaceJMSQueueSubscriber” \
-Dsolace.host=localhost:55557 \
-Dsolace.vpn=default \
-Dsolace.user=default \
-Dsolace.password=default \
-Dsolace.queue=q \
-Dsolace.topic=solace/tracing \
-jar solace-queue-receiver.jar
What happens behind the scenes when an application uses the JMS Java API to publish or subscribe on the event broker is that the OTel Java Agent intercepts the call with the help of the Solace OTel JMS integration extension and generates spans to the OTLP receiver in the OTel collector. This generates spans on the API level. Broker-level spans are generated from the Solace PubSub+ Event Broker upon arrival of the message on the broker after it’s enqueued. The collector generates and receives further broker-specific spans in the collector and processes them into the OTel-specific format. All the generated spans from the different steps are then exported and stitched for further processing.
The following figure illustrates the details of the inner workings of the Java auto-instrumentation agent:
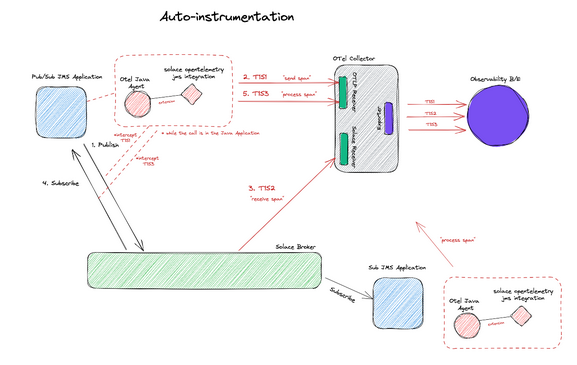
The advantage of such an approach is that the Java auto-instrumentation agent takes care of span generation on the API level without the need for code changes or application business logic configuration. The drawback is that you can’t add further customization on the different spans generated to get a more detailed picture of what’s happening in the business logic of the microservice.
Instrumenting Using an SDK: Manual Instrumentation
In some cases, developers want to have more control over when spans are generated and what attributes are included in the span during the business logic of the microservice, hence they generate application-level traces. This is done using the OTel SDK and broker-specific APIs that support span generation and context propagation.
Developers can interact with the event broker through APIs in multiple languages. In the following example, I will be using the latest Java API for the Solace Messaging Platform, also known as JCSMP, which supports span generation and context propagation for distributed tracing. For a publishing application to support manual instrumentation directly from the business logic, the following needs to be done:
- Import the OpenTelemetry and Solace libraries for context propagation:
import com.solace.messaging.trace.propagation.SolaceJCSMPTextMapGetter;
import com.solace.messaging.trace.propagation.SolaceJCSMPTextMapSetter;
import com.solace.samples.util.JcsmpTracingUtil;
import com.solace.samples.util.SpanAttributes;
import com.solacesystems.jcsmp.*;
import io.opentelemetry.api.trace.Span;
import io.opentelemetry.api.trace.SpanKind;
import io.opentelemetry.api.trace.StatusCode;
import io.opentelemetry.context.Scope;
import io.opentelemetry.context.propagation.TextMapPropagator;
import io.opentelemetry.context.Context;
- Extract message context, if it exists, before injecting any new context into the message:
final SolaceJCSMPTextMapGetter getter = new SolaceJCSMPTextMapGetter();
final Context extractedContext = JcsmpTracingUtil.openTelemetry.getPropagators().getTextMapPropagator()
.extract(Context.current(), message, getter);
- Set the extracted context as the current context of a created span, and add any attributes you want to the generated span:
final Span sendSpan = JcsmpTracingUtil.tracer
.spanBuilder(SERVICE_NAME + ” ” + SpanAttributes.MessagingOperation.SEND)
.setSpanKind(SpanKind.CLIENT)
.setAttribute(SpanAttributes.MessagingAttribute.DESTINATION_KIND.toString(),
SpanAttributes.MessageDestinationKind.TOPIC.toString())
.setAttribute(SpanAttributes.MessagingAttribute.IS_TEMP_DESTINATION.toString(), “true”)
//Set more attributes as needed
.setAttribute(“myKey”, “myValue” + ThreadLocalRandom.current().nextInt(1, 3))
.setParent(extractedContext) // set extractedContext as parent
.startSpan();
- Inject the new context into the message:
final SolaceJCSMPTextMapSetter setter = new SolaceJCSMPTextMapSetter();
final TextMapPropagator propagator = JcsmpTracingUtil.openTelemetry.getPropagators().getTextMapPropagator();
propagator.inject(Context.current(), message, setter);
- Send the message to the Solace broker:
producer.send(message, topic);
That’s it! The following figure illustrates the details of how manual instrumentation is achieved from the application level:
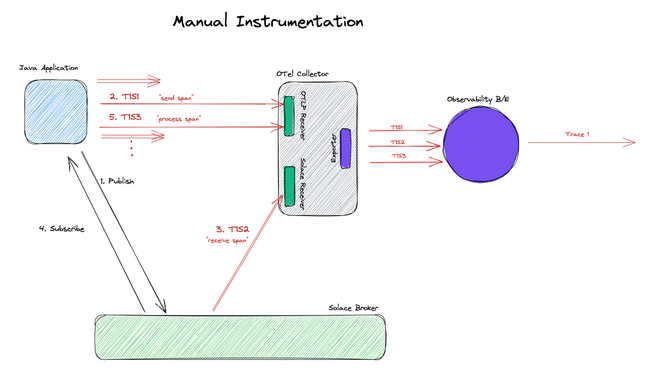
The advantage of such an approach is having full control over what attributes are included in the generated span and when the span is generated. A developer also has control over generating other custom spans that are not related to messaging. It is, however important to note that this adds further complexity in application development, and the order of span generation becomes an implementation detail.
Conclusion
In conclusion, the Solace PubSub+ Event Broker is one of the many existing message-broker technologies that could be used for communication in EDA systems. The OpenTelemetry project helps to answer observability-related questions in the system from an application and API level. Broker-level instrumentation requires vendor-specific customization to define the activities within the broker that result in span generation. There are two approaches to generating spans in an EDA system: auto-instrumentation and manual instrumentation. Using the Solace PubSub+ Event Broker within an EDA system, you can get more visibility on what happens to the message within the broker during the lifecycle of a transactional event.
For more information on how to configure a distributed tracing-enabled event mesh with auto and manual instrumented applications, you can take a look at this step-by-step tutorial. For further resources on OTel and how it fits in a distributed EDA system, check out this short video series. And if you’re interested in learning more about how Solace supports open source initiatives, visit the CNCF resources page for Solace.
Happy coding!
Author

Contributed by
Tamimi Ahmad, Solace
