


In Steampipe unbundled we showed how its plugins, which originally worked only with the foreign data wrapper loaded into Steampipe’s batteries-included Postgres, are now also available as stand-alone distributions that you can load into your own instances of Postgres or SQLite. Now Steampipe itself is unbundled: its dashboard server and benchmark runner have migrated to a new open-source project, Powerpipe.
When you start Powerpipe it defaults to a local instance of Steampipe so existing dashboards and benchmarks work as always. The mods that drive them source their data from the same plugins, using the same SQL queries. But you can use Powerpipe’s --database argument to specify a Postgres, SQLite, DuckDB, or MySQL connection string.
Why unbundle Steampipe in this way? Unix philosophy holds that a software tool should do one thing well, and combine readily with other tools that abide by the same principle. Steampipe began that way, but as the dashboard and benchmark layers appeared it became clear that refactoring was in order. For devops engineers who use the tool to visualize and assess cloud infrastructure, it makes sense to decouple those layers into components with well-defined interfaces. But Powerpipe isn't just for them. Among the set of new mods released with Powerpipe, there’s one that visualizes biomedical data from RNACentral by way of a public Postgres endpoint. To view those dashboards you install the mod, then start Powerpipe like so:
powerpipe server --database postgres://reader:NWDMCE5xdipIjRrp@hh-pgsql-public.ebi.ac.uk:5432/pfmegrnargs
The dashboards are now browseable at http://localhost:9033.
You can of course connect any Postgres client to that endpoint. What Powerpipe brings to the party is an as-code approach to visualizing and validating data. The widgets that drive dashboards and benchmarks are written in a declarative language, HCL, that complements the declarative SQL queries that fill those widgets with data. All your HCL and SQL code lives in repos, under version control, open to the same kind of collaboration that you expect and enjoy for all other code artifacts.
Working with that code is a developer-friendly experience in another way too. Powerpipe watches your files and reacts instantly when you make changes to either the HCL that configures dashboard widgets or the SQL that populates them.
 IDG
IDGSQL-powered relationship graphs
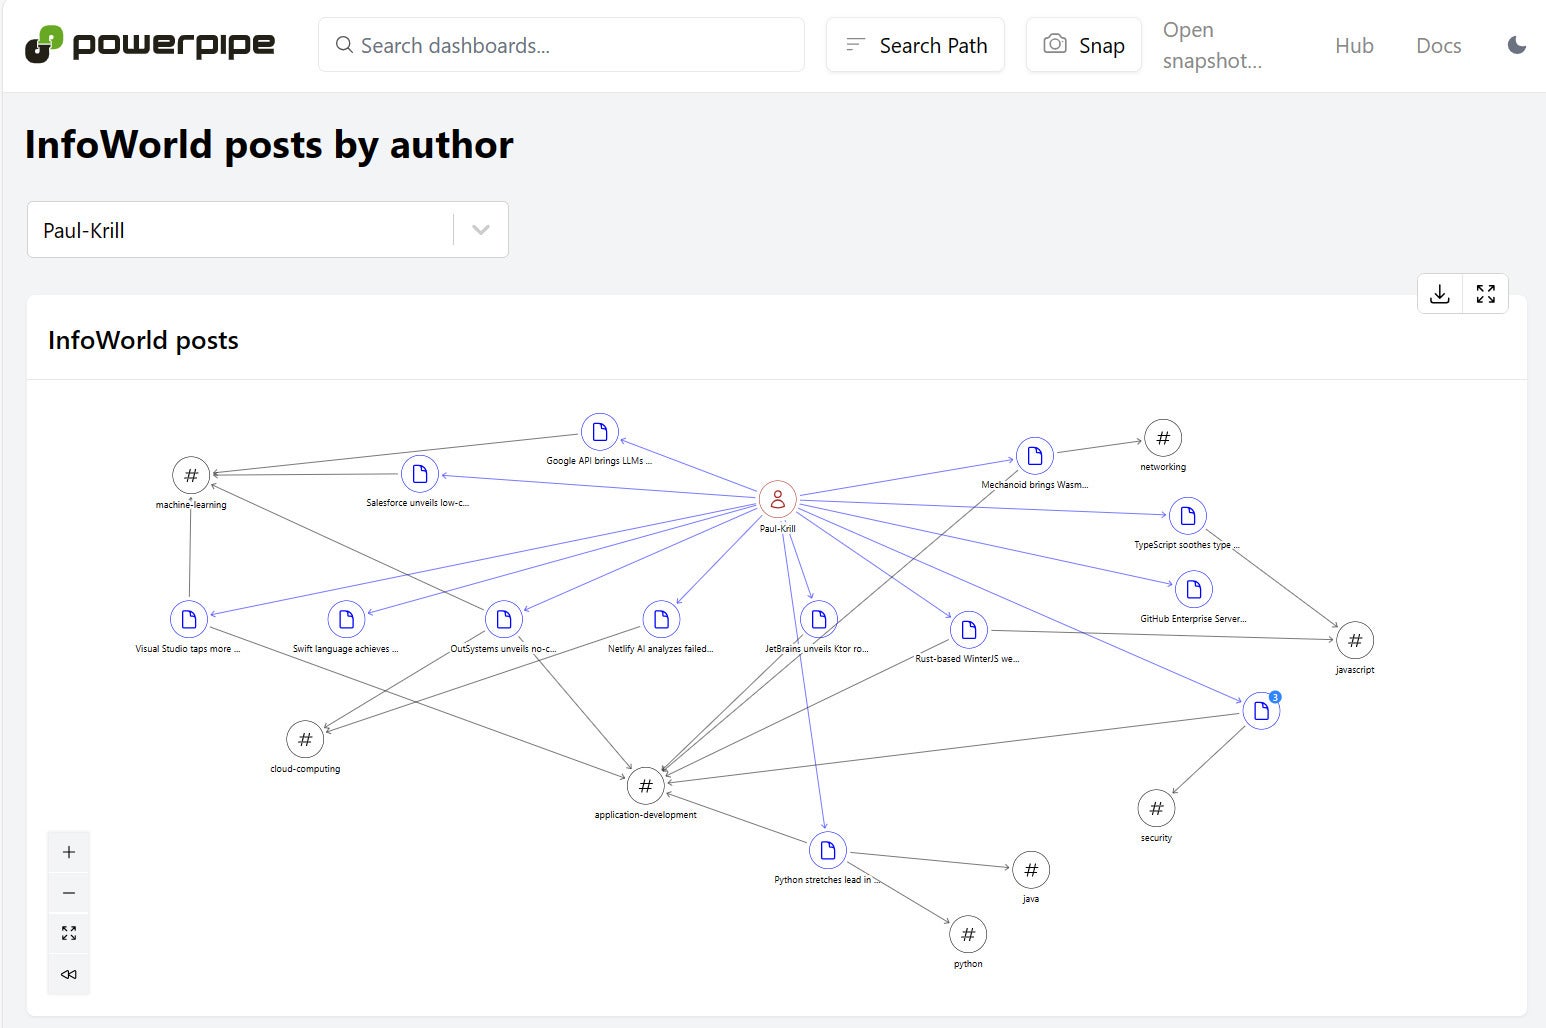
The suite of dashboard components includes everything you’d expect, including tables, charts, infocards, and input widgets. It also includes some things you might not expect, notably the nodes and edges that form relationship graphs. Here’s an example that uses a select widget to choose an InfoWorld author, then builds a graph that relates the chosen author to articles written and to the (perhaps multiple) categories associated with each article.
 IDG
IDGHere’s how the nodes and edges are defined. Two of the nodes query for categories and authors, and the third uses the RSS plugin to query the selected author’s RSS feed. Then two edges connect the nodes. One relates article links to authors, the other relates the same links to categories. It’s all just SQL, leveraged in an unconventional way.
-- enumerate categories
node {
  category = category.category
  sql = <<EOQ
    select
      category as id,
      category as title
    from
      infoworld_categories()
  EOQ
}

-- enumerate authors
node {
  category = category.author
  args = [self.input.authors.value]
  sql = <<EOQ
    select
      author as id,
      author as title
    from
      infoworld_authors()
    where
      author = $1
  EOQ
}

-- list articles by author
node {
  args = [self.input.authors.value]
  category = category.post
  sql = <<EOQ
  with feed_links as materialized (
    select
      author,
      'https://www.infoworld.com/author/' || author || '/index.rss' as feed_link
    from infoworld_authors()
  )
  select
    link as id,
    title as title,
    author,
    jsonb_build_object(
      'link', link,
      'author', author,
      'published', published
    ) as properties
  from
    rss_item r
  join
    feed_links f
  using (feed_link)
  where author = $1
  order by
    published desc
  EOQ
}

-- relate articles to authors
edge {
  args = [self.input.authors.value]
  sql = <<EOQ
    with feed_links as materialized (
      select
        author,
        'https://www.infoworld.com/author/' || author || '/index.rss' as feed_link
      from infoworld_authors()
    )
    select
      link as to_id,
      author as from_id
    from
      rss_item r
    join
      feed_links f
    using (feed_link)
    where
      author = $1
  EOQ
}

-- relate articles to categories
edge {
  sql = <<EOQ
    select
      link as to_id,
      category as from_id
    from
      infoworld_category_urls()
  EOQ
}
More typical uses of these relationship graphs help devops engineers understand how the elements of their cloud infrastructures fit together, as for example in this graph which shows how the components of a Kubernetes deployment—deployments, replicasets, pods, containers, servers, and nodes—relate to one another. Each entity in the graph is hyperlinked to another graph that drills into the entity and details its surrounding infrastructure.
 IDG
IDGThese visualizations, which are also available for AWS, Azure, and GCP, are an excellent way to explore and understand your cloud architectures. And the queries you write to do that are reusable. You can flow the same data into dashboard charts and tables.
SQL-powered benchmarks and controls
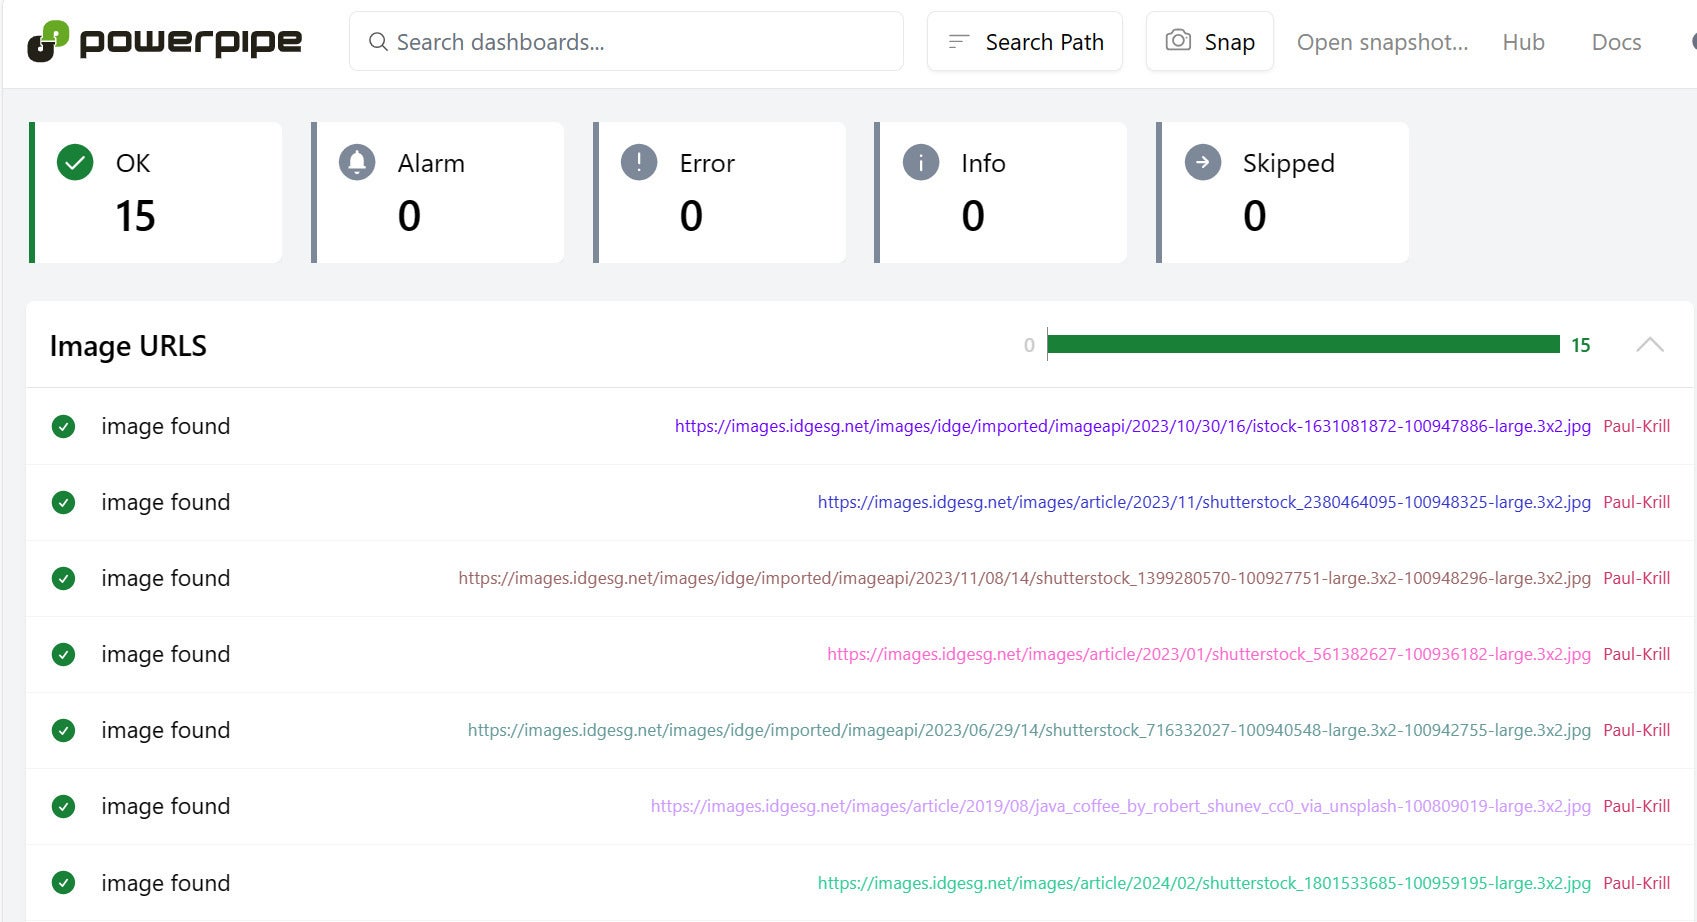
Powerpipe is also the engine that powers suites of compliance benchmarks, also for AWS, Azure, GCP, Kubernetes, and others. Here’s a benchmark that validates the image URLs embedded in the extensions field of InfoWorld RSS feeds.
 IDG
IDGAnd here's how it’s defined. The benchmark includes one control that runs a multistep query to select feed URLs for authors, drill into each item’s media tag, then check the HTTP response code for each URL.
control "image_urls" {
  title = "Image URLS"
  sql = <<EOT
  with authors as (
    select
    author,
    'https://www.infoworld.com/author/' || author || '/index.rss' as feed_link
    from
      infoworld_authors()
    limit 1
  ),
  image_urls as materialized (
    select
      a.author,
      r.extensions -> 'media' -> 'content' -> 0 -> 'attrs' ->> 'url' as url
    from
      authors a
    join
      rss_item r
    using (feed_link)
  ),
  response_codes as (
    select
      i.author,
      n.url,
      n.response_status_code
    from
      net_http_request n
    join
      image_urls i
    using (url)
  )
  select
    url as resource,
    case when response_status_code = 200 then 'ok'
    else 'alarm'
   end as status,
    case when response_status_code = 200 then 'image found'
    else 'image not found'
   end as reason,
   substring(url from 1 for 150),
   author
  from response_codes
  EOT
}

benchmark "feeds" {
  title = "Check InfoWorld feeds"
  children = [
    control.image_urls
  ]
}
Notable points here:
- The
feed_linkcolumn returned from the first CTE (common table expression) joins with its counterpart in the RSS plugin to fetch the feed for each author. - Because the back end is Steampipe, which is Postgres-based, the Postgres JSONB operators are available to drill into the
mediatag and extract the URL. - Each
urlthen joins with the corresponding column of the Net plugin—an HTTP client wrapped as a database table!—to check the response code.
A control is just a SQL query that returns the required columns status, reason, and resource. You can think of a control as a unit test for data, with Powerpipe as the testrunner.
These controls typically support standard compliance suites: CIS, FedRamp, GDPR, HIPAA, NIST, PCI, SOC 2, and more. Mods like AWS Compliance offer broad and deep support for these, building on the equally broad and deep API coverage provided by Steampipe plugins like the one for AWS.
But you can build benchmark mods to validate any kind of data, wherever it lives: in ephemeral tables populated by cloud services via plugins, or in your own databases as native tables.
Dashboards and benchmarks as code
Whether you’re visualizing data with interactive tables, charts, and graphs, or validating data using controls, the model is the same. You use SQL queries to acquire the data, and HCL widgets to display it, with live editing in both cases. The code lives in packages called mods that you can install, create, and remix.
Like the Steampipe product from which it was decoupled, Powerpipe is a single binary that you can run locally, or in a cloud VM, or in a CI/CD pipeline. And like Steampipe, it’s available in hosted form at Turbot Pipes where you can collaborate with your team and share snapshots of dashboards and benchmarks.
The existing suites of Powerpipe dashboards and benchmarks focus on what devops folk need most: a standard query language, with live access to cloud APIs, embedded in HCL wrappers that live in repositories along with the rest of your managed code. That’s the sweet spot, but with the unbundling of Steampipe you can now use the same technologies more broadly.