How to create Cloudwatch alarms for a Lambda Function on AWS
There are various invocation metrics, performance metrics, and concurrency metrics available for Lambda functions in Cloudwatch to monitor. Invocation metrics are the outcome of an invocation and binary in nature, performance details about a single invocation are provided by Performance metrics.
- Invocations – The number of times the Lambda function code is executed, including successful executions and unsuccessful executions that result in a function error.
- Errors – This returns the number of unsuccessful invocations that result in a function error that includes exceptions thrown by the Lambda code and exceptions thrown by the Lambda runtime.
- DeadLetterErrors – This returns the number of times Lambda attempts to send an event to a dead-letter queue but fails for asynchronous invocation.
- DestinationDeliveryFailures – This returns the number of times Lambda attempts to send an event to a destination but fails for asynchronous invocation.
- Throttles – This gives the number of invocations that are throttled.
- ProvisionedConcurrencyInvocations – This gives the number of times the Lambda function code is executed on provisioned concurrency.
- ProvisionedConcurrencySpilloverInvocations – This gives the number of times the Lambda function code is executed on standard concurrency when all provisioned concurrency is in use.
- Duration – This returns the amount of time that the Lambda function code spends processing an event.
- PostRuntimeExtensionsDuration – This is the cumulative amount of time that the Lambda function runtime spends running code for extensions after the function code has completed.
- IteratorAge – This is the age of the last record in the event for event source mappings that read from streams.
- ConcurrentExecutions – This gives the number of Lambda function instances that are processing events.
- ProvisionedConcurrentExecutions – This returns the number of Lambda function instances that are processing events on provisioned concurrency.
- ProvisionedConcurrencyUtilization – This returns the value of ProvisionedConcurrentExecutions divided by the total amount of provisioned concurrency allocated for a version or alias.
- UnreservedConcurrentExecutions – This returns the number of events being processed by Lambda functions that do not have reserved concurrency.
Click here to know more about metrics available for Lambda functions.
In this article, we will create an alarm for the "Invocations" metric which will send a notification to the SNS topic when it is triggered. Before we proceed, it is assumed that you are familiar with Lambda functions and SNS topics. Also, it is assumed that you already have a Lambda function and an SNS topic.
Pre-requisites
- AWS Account(Create if you don’t have one).
- Lambda function(Click here to learn to create a Lambda function to start and stop an EC2 instance).
- SNS Topic(Click here to learn to create an SNS Topic using Cloudformation)
What will we do?
- Login to AWS.
- Create an alarm for the existing Lambda function.
Login to AWS
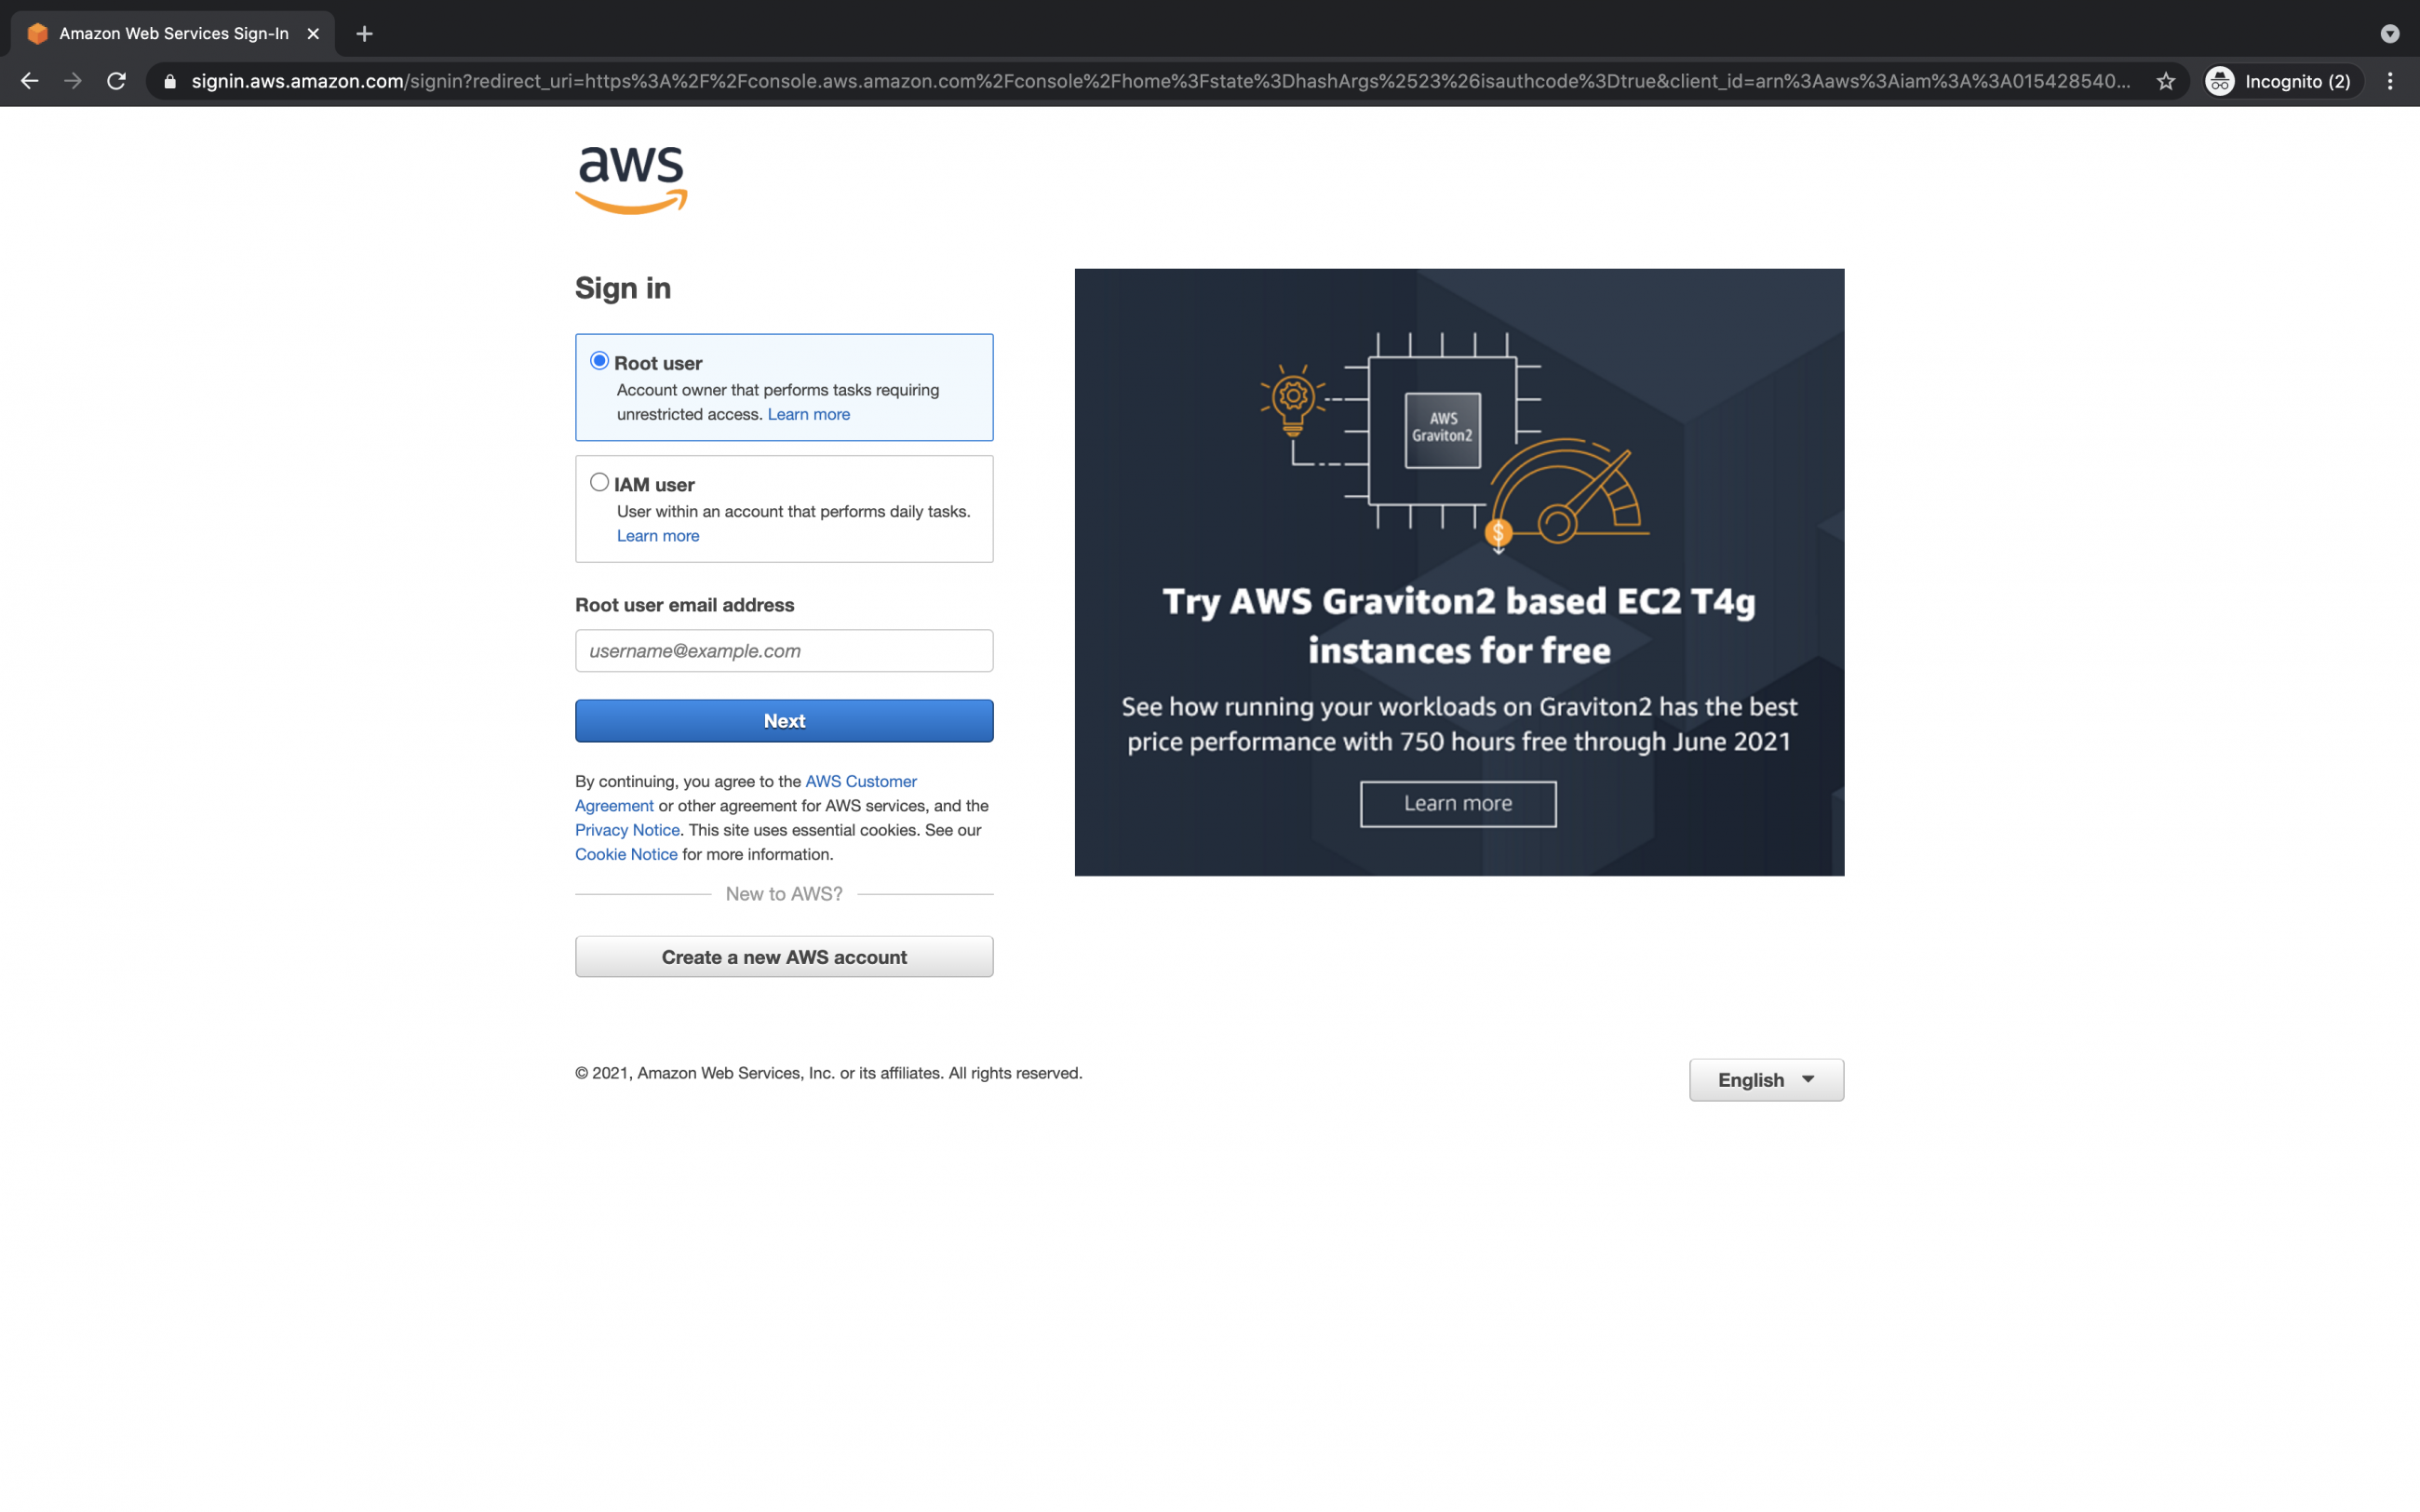
Click here to go to AWS Login Page.
You will see the login page as follows when you hit the above link. Enter your credentials to login into your AWS account.
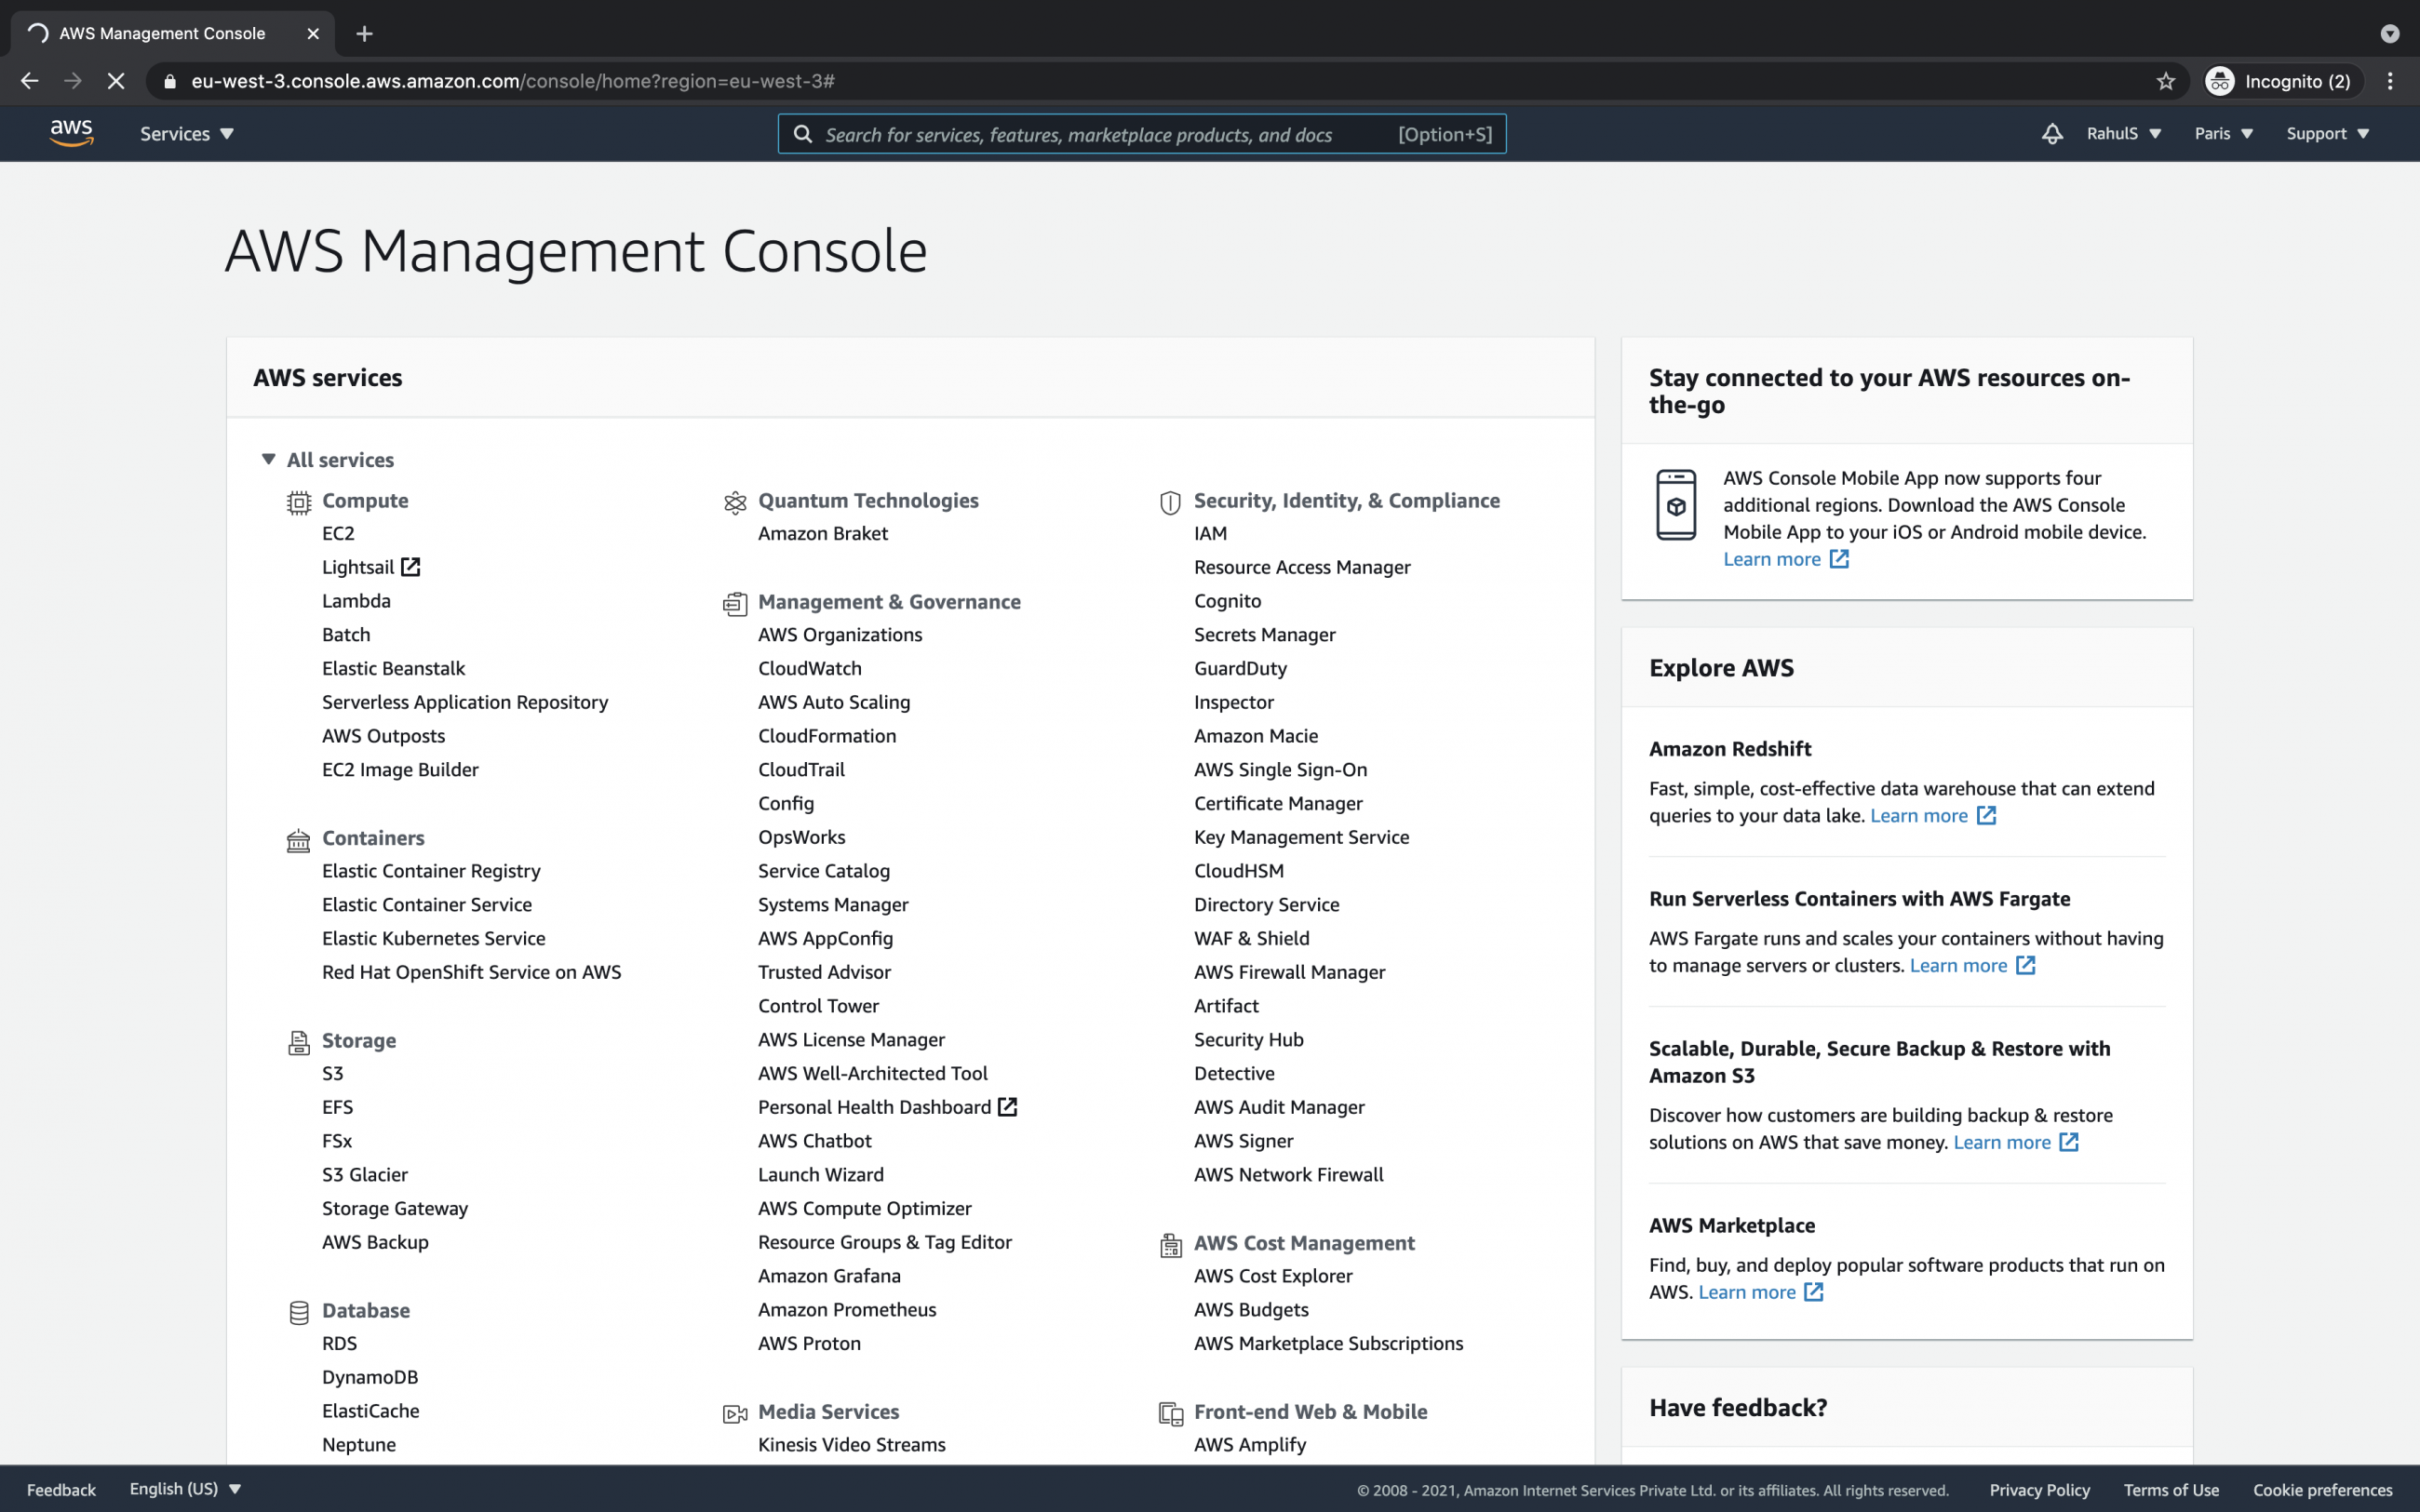
You will see the main AWS Management Console as follows when you successfully login into your account.
Create an alarm for the existing Lambda function
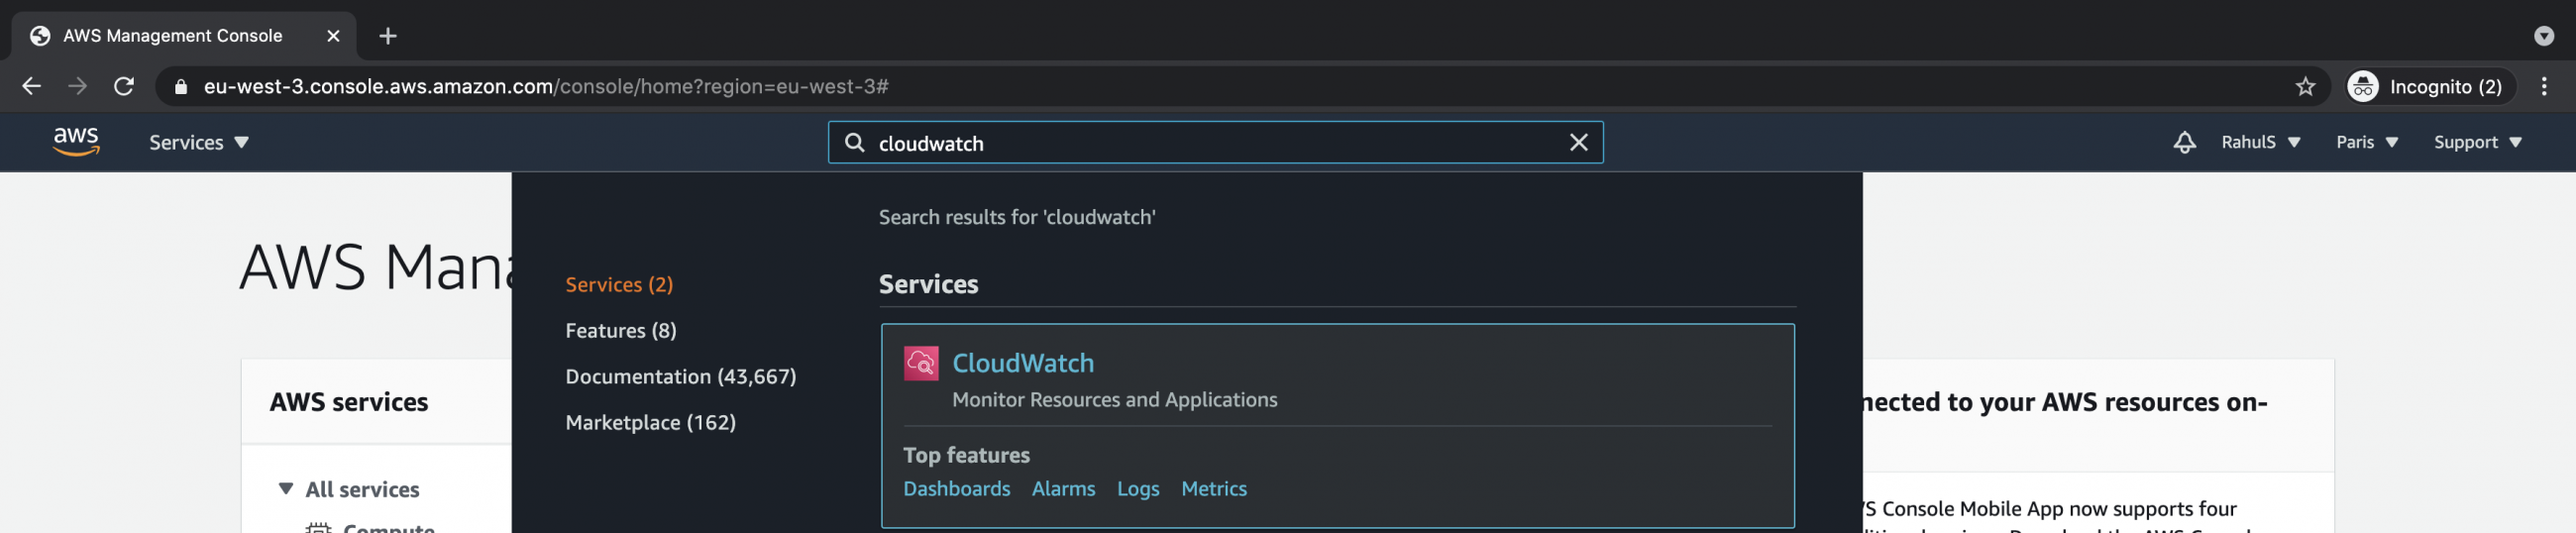
To create an alarm for an existing Lambda function, go to the Cloudwatch dashboard. Search for Cloudwatch in the search box at the top of the screen.
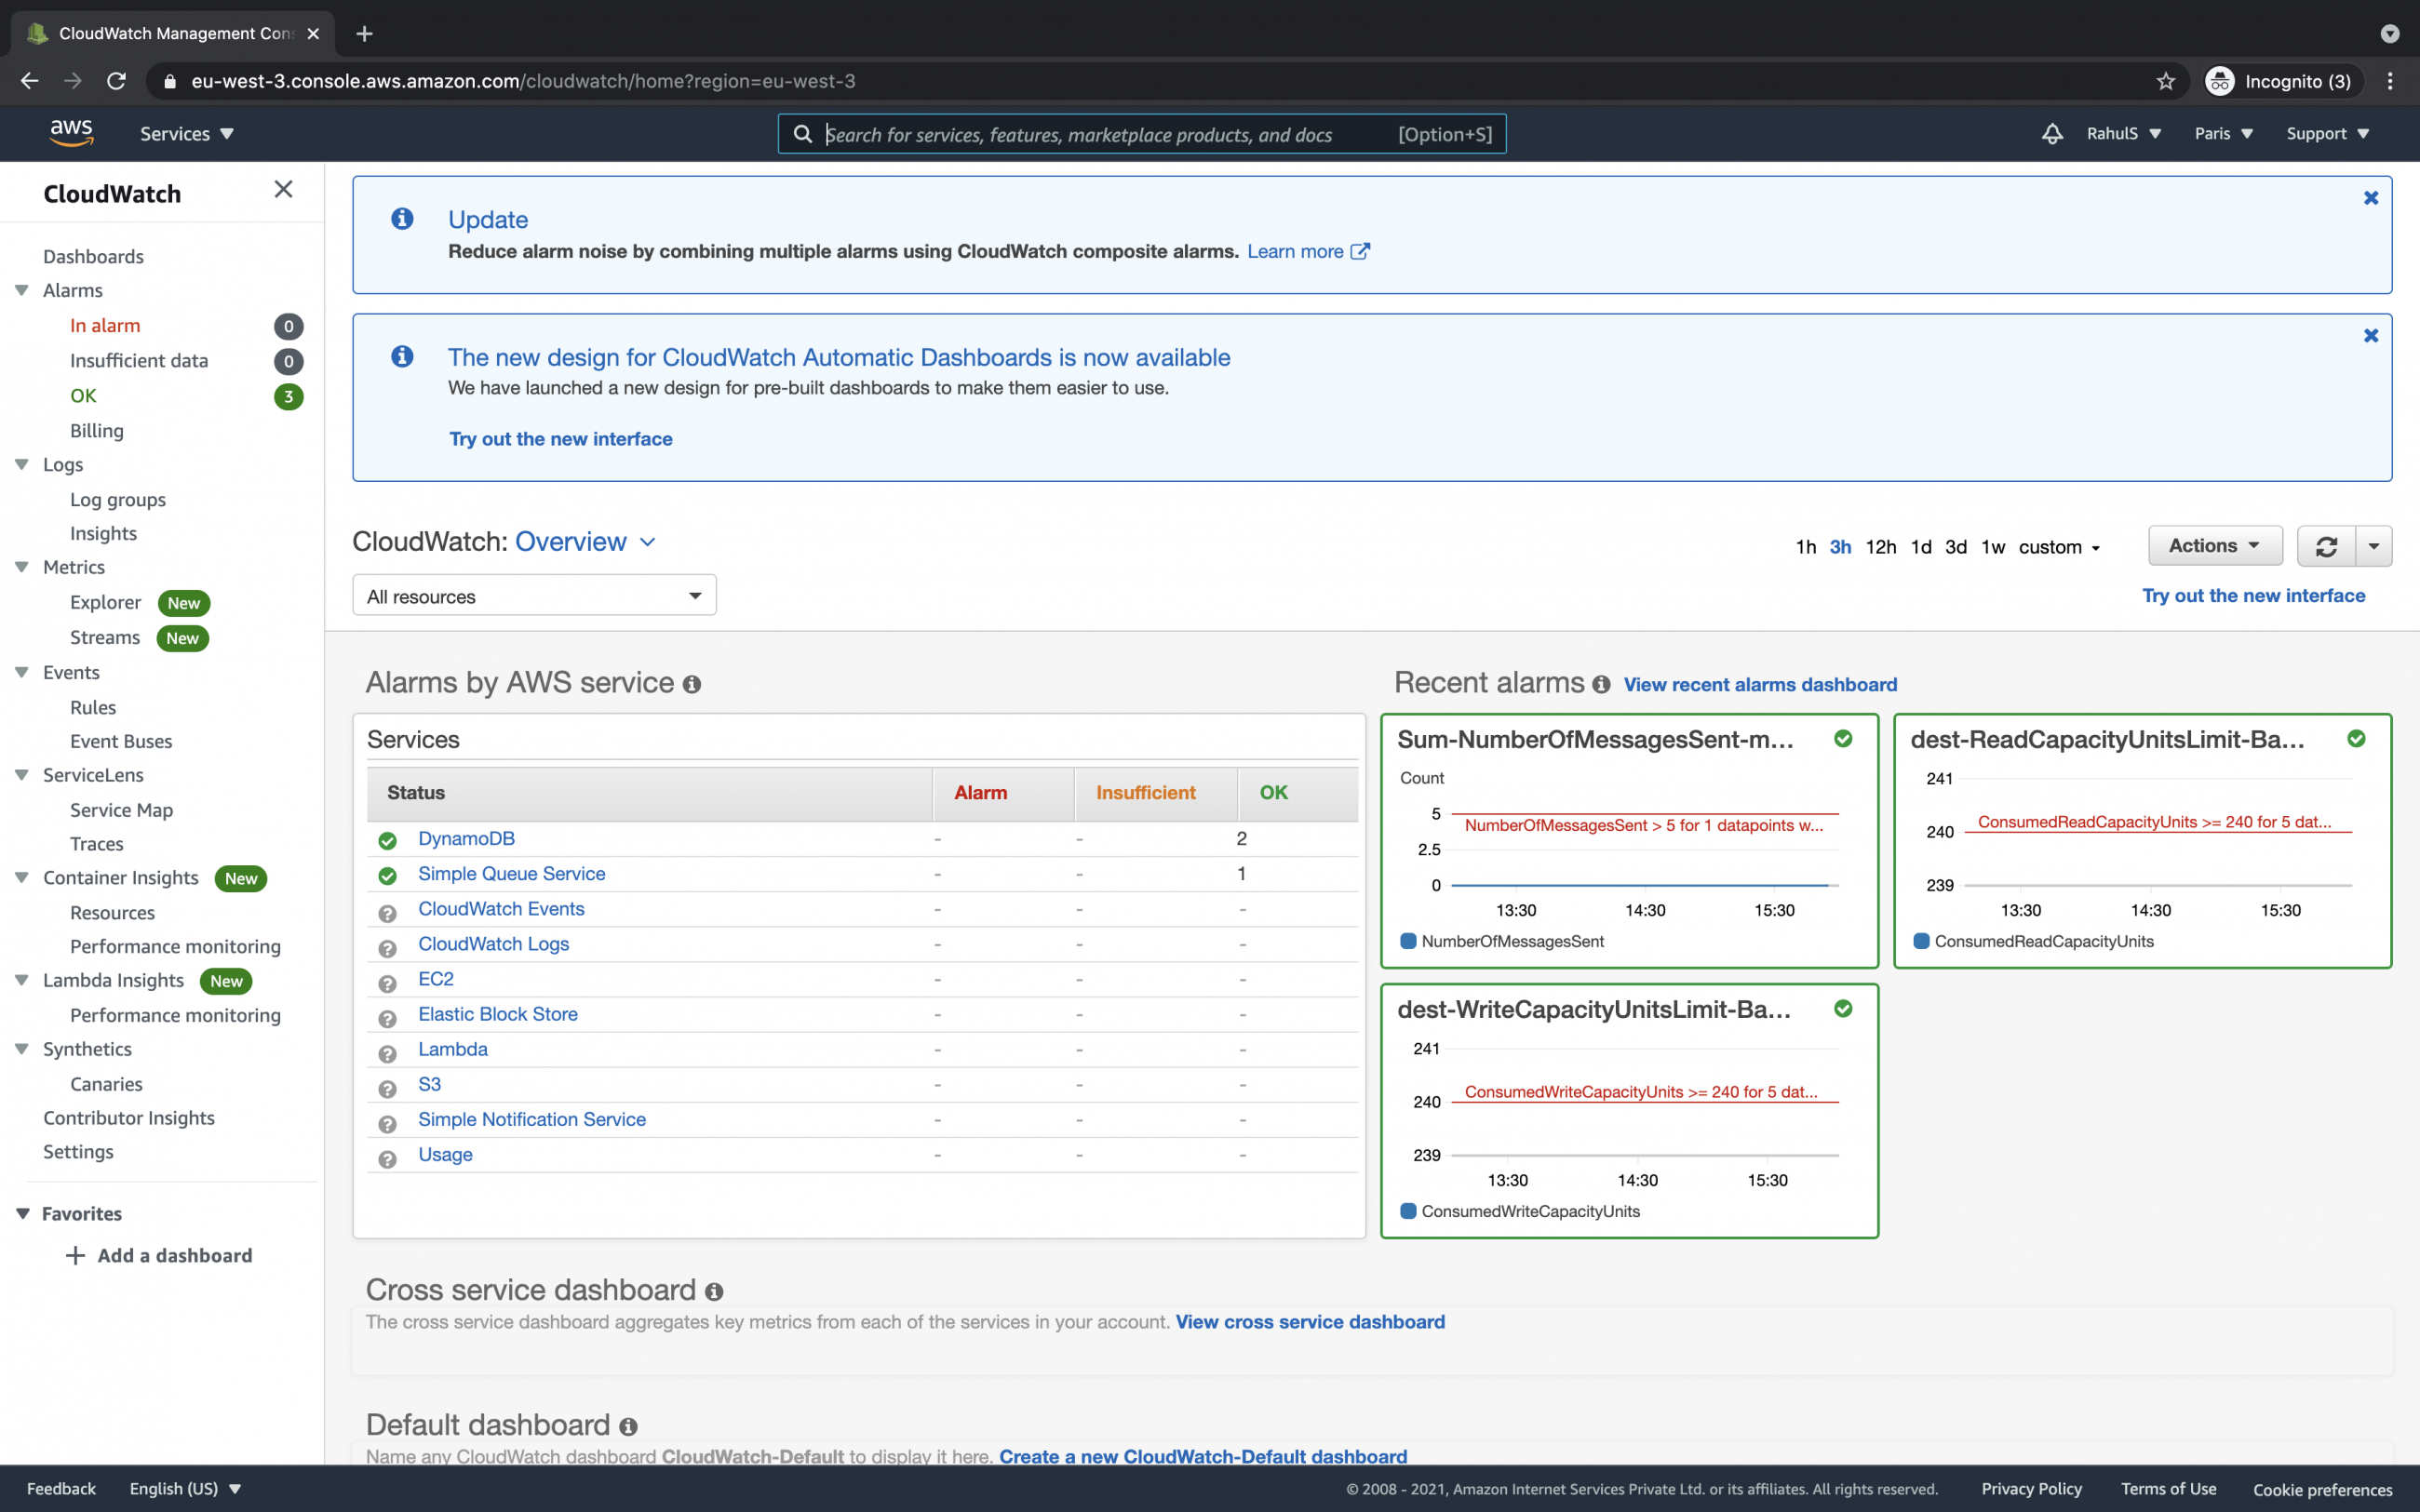
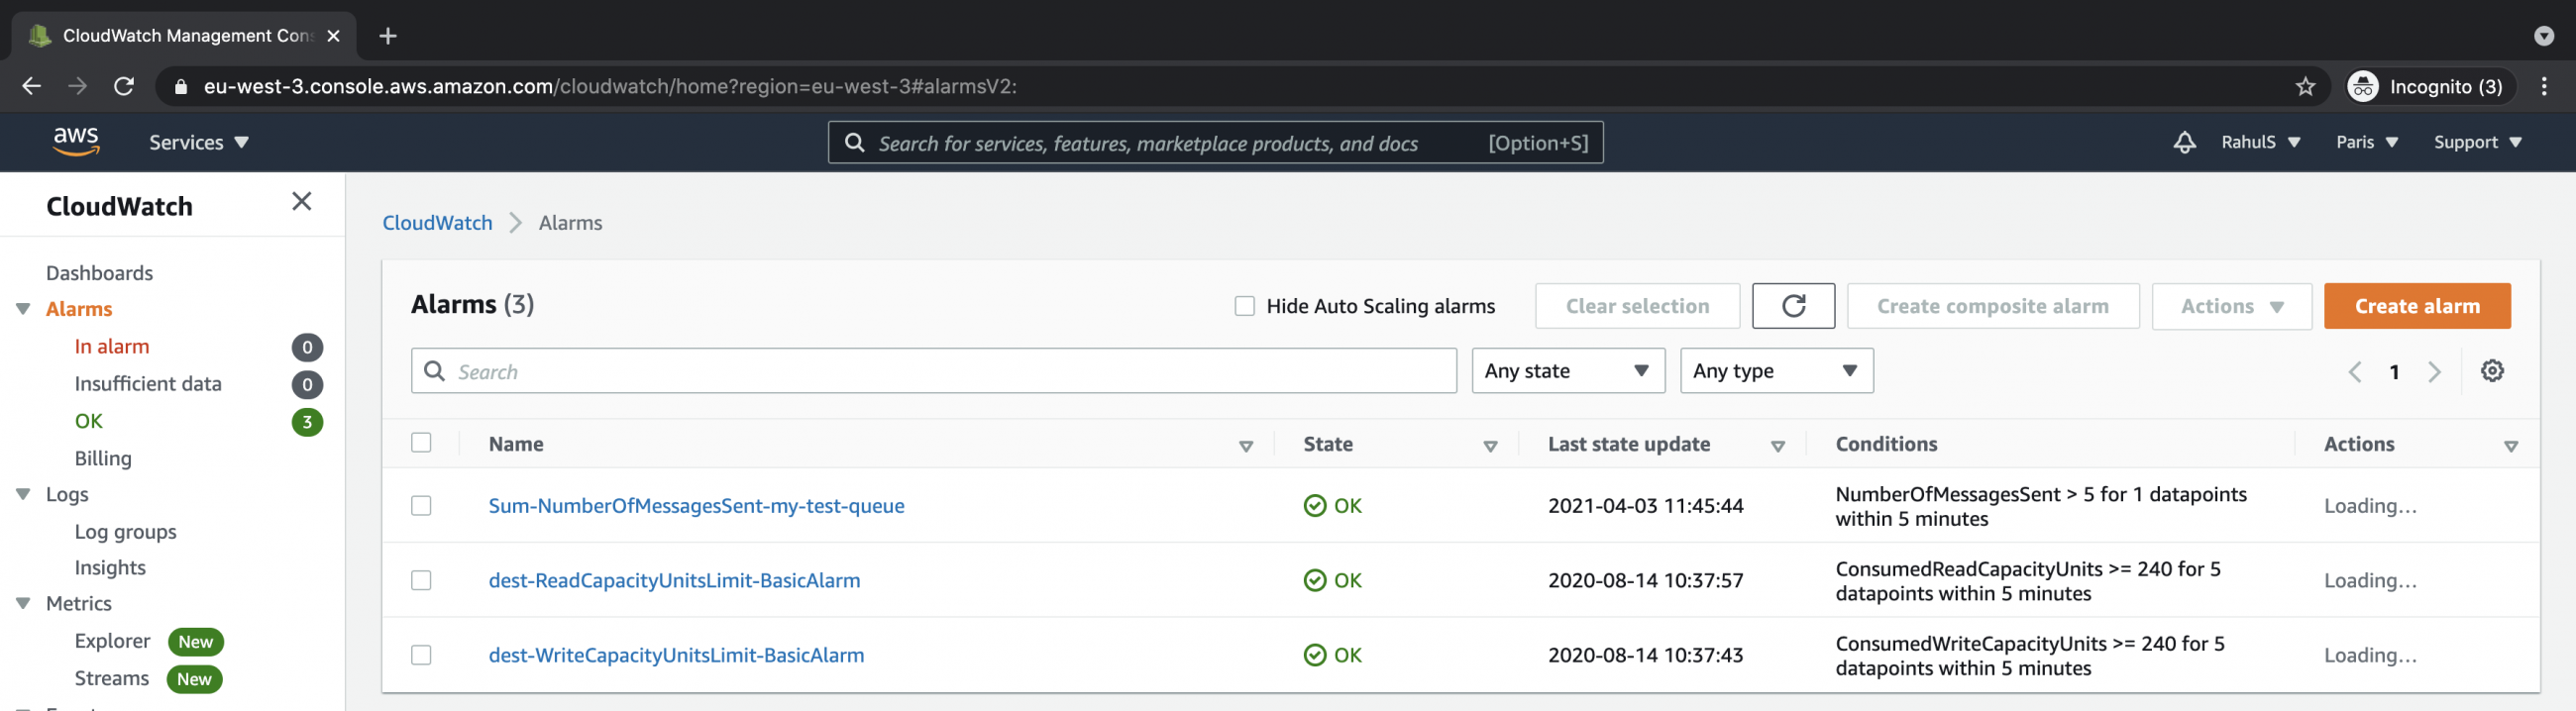
You will see the overview screen of Cloudwatch as follows. Click on "Alarms" in the left panel.
If you have any existing alarms in your account under the selected region, you will see them here. To create a new alarm for an existing lambda function click on the "Create alarm" button.
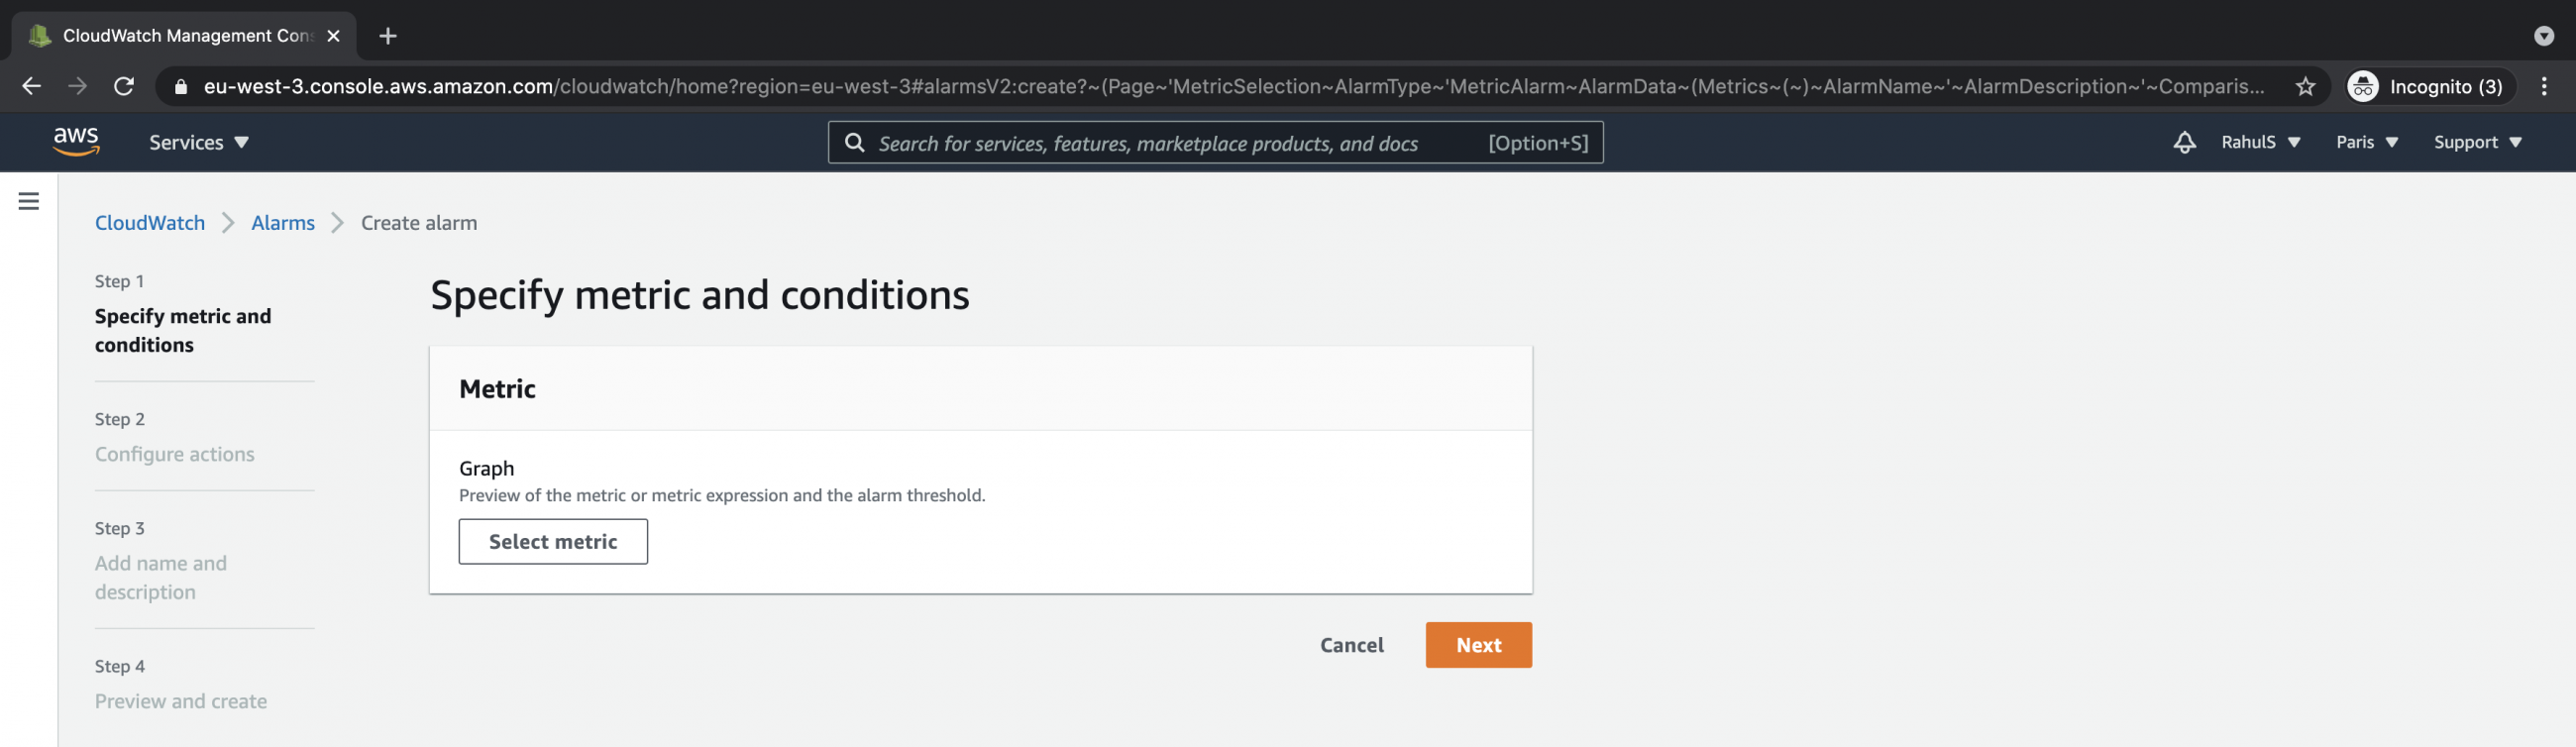
You will get a screen to specify a metric and conditions. Click on the "Select metric" button.
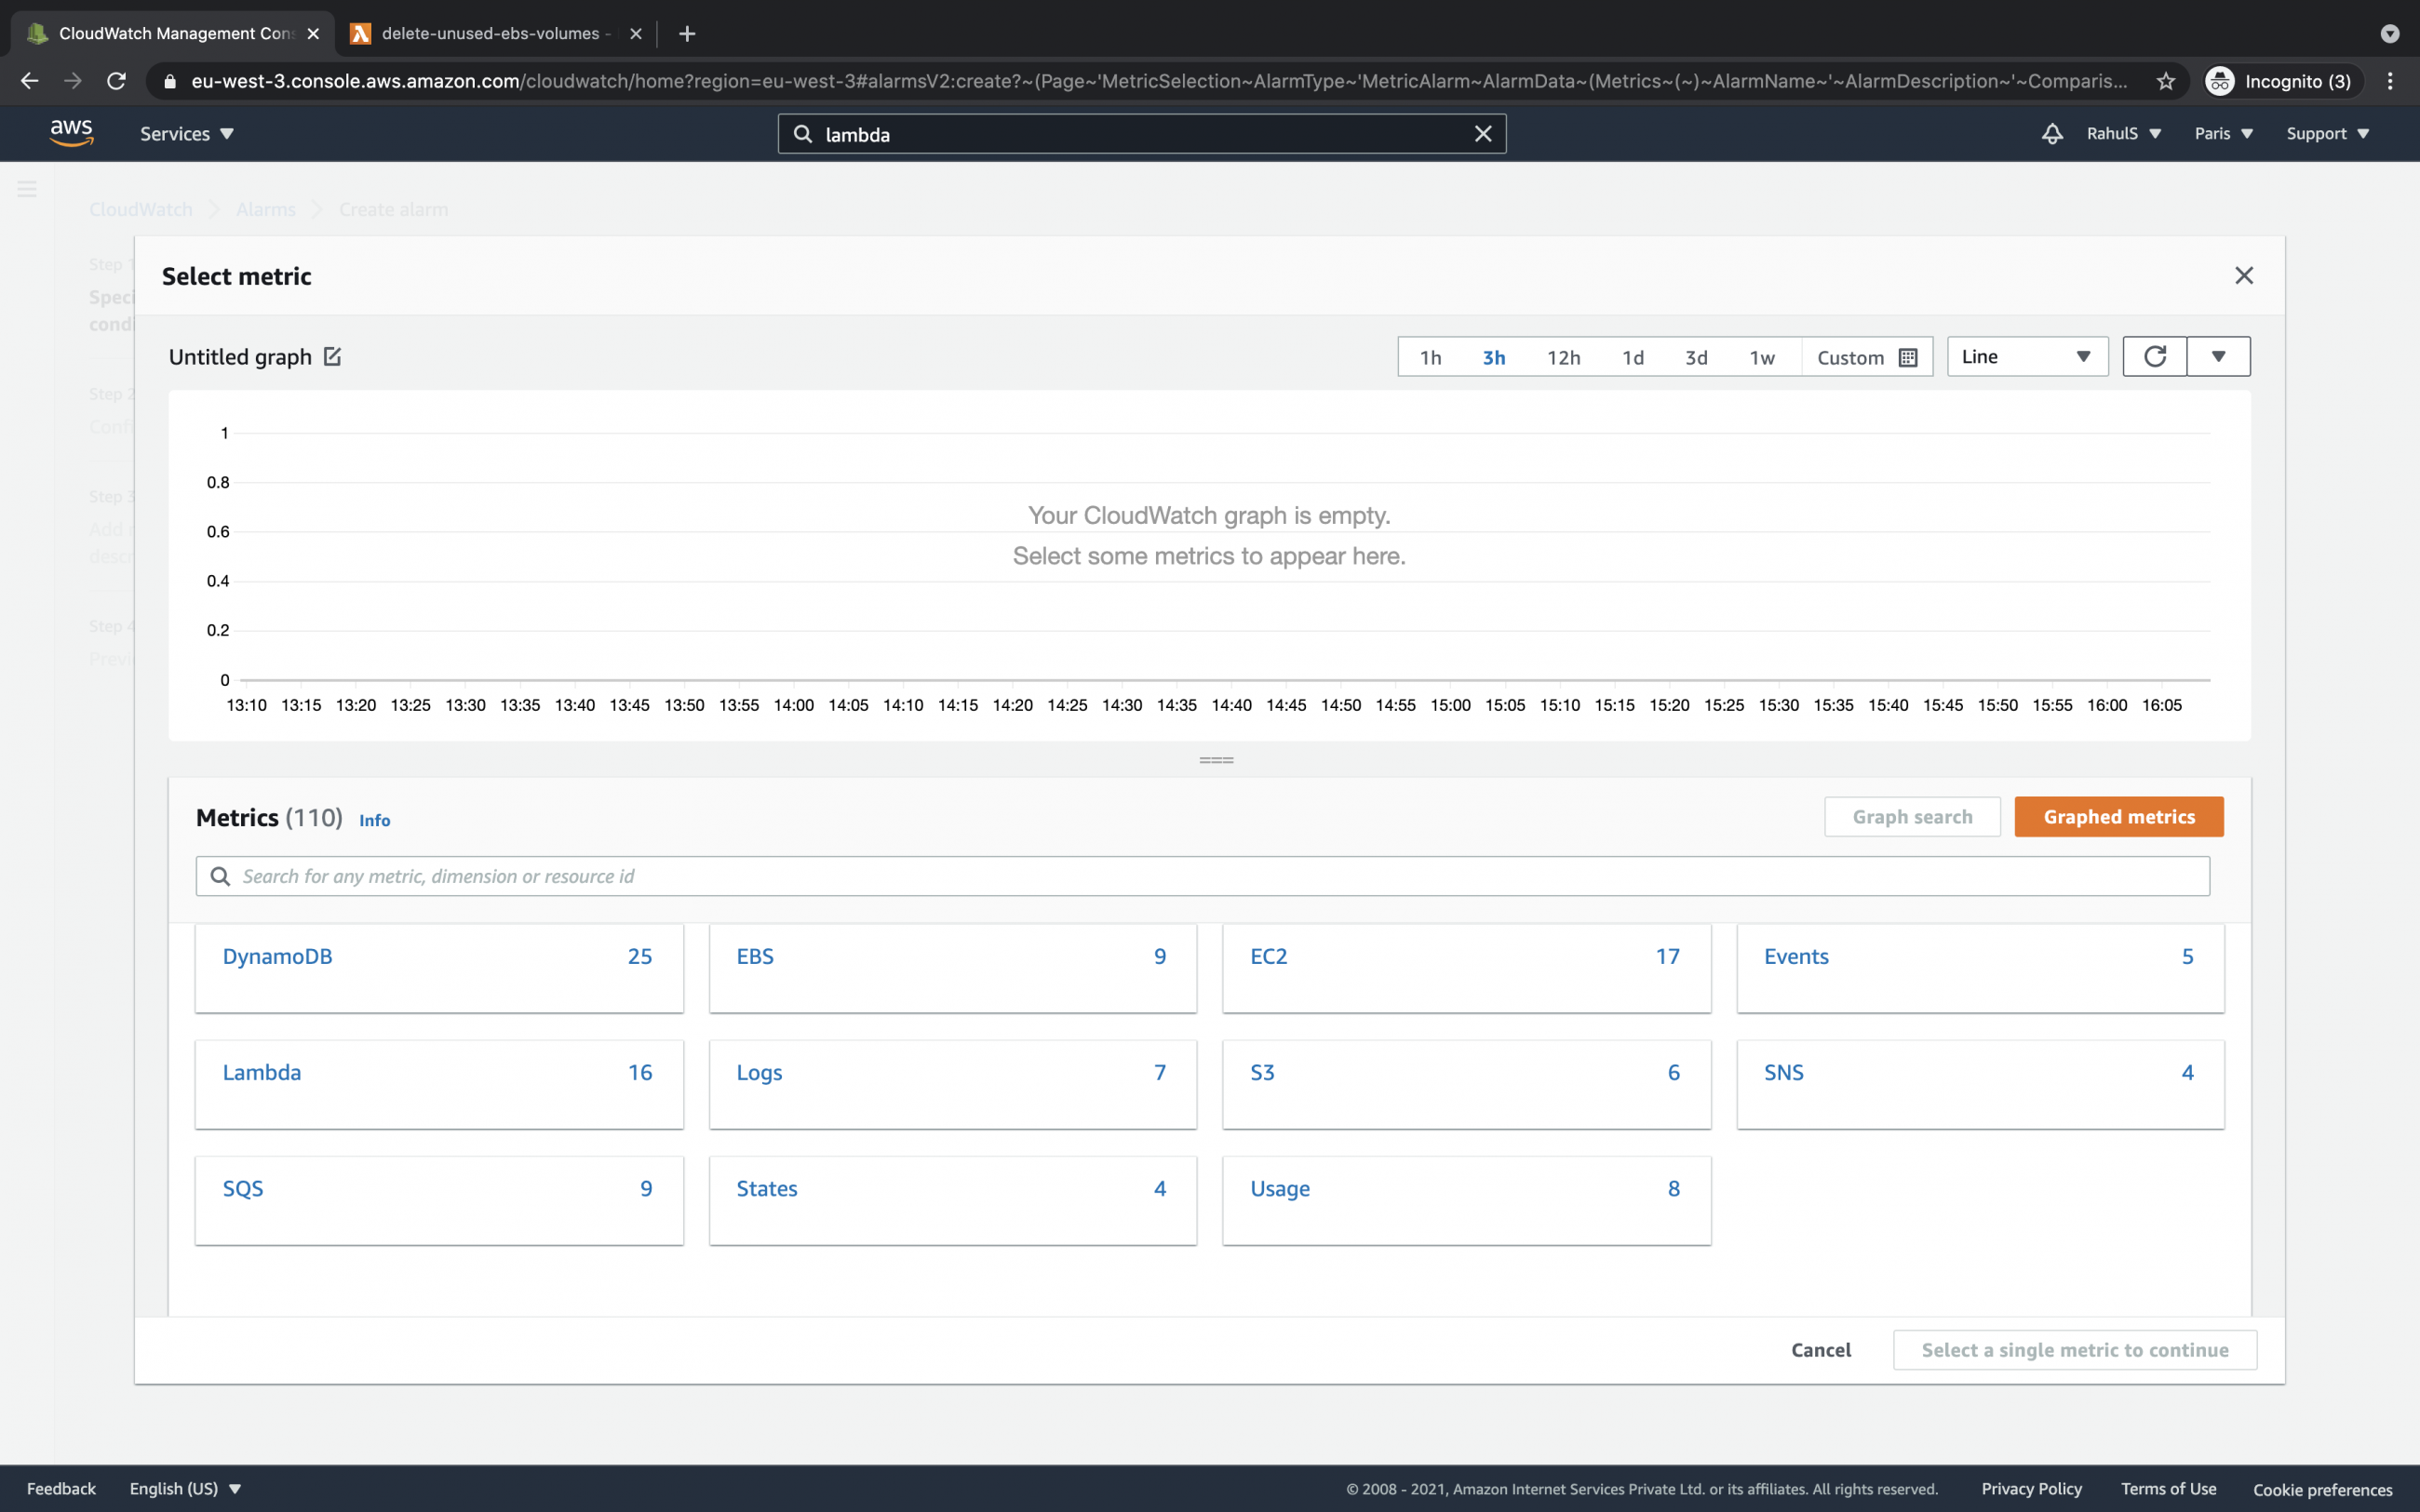
Here you will find services with metrics available for them.
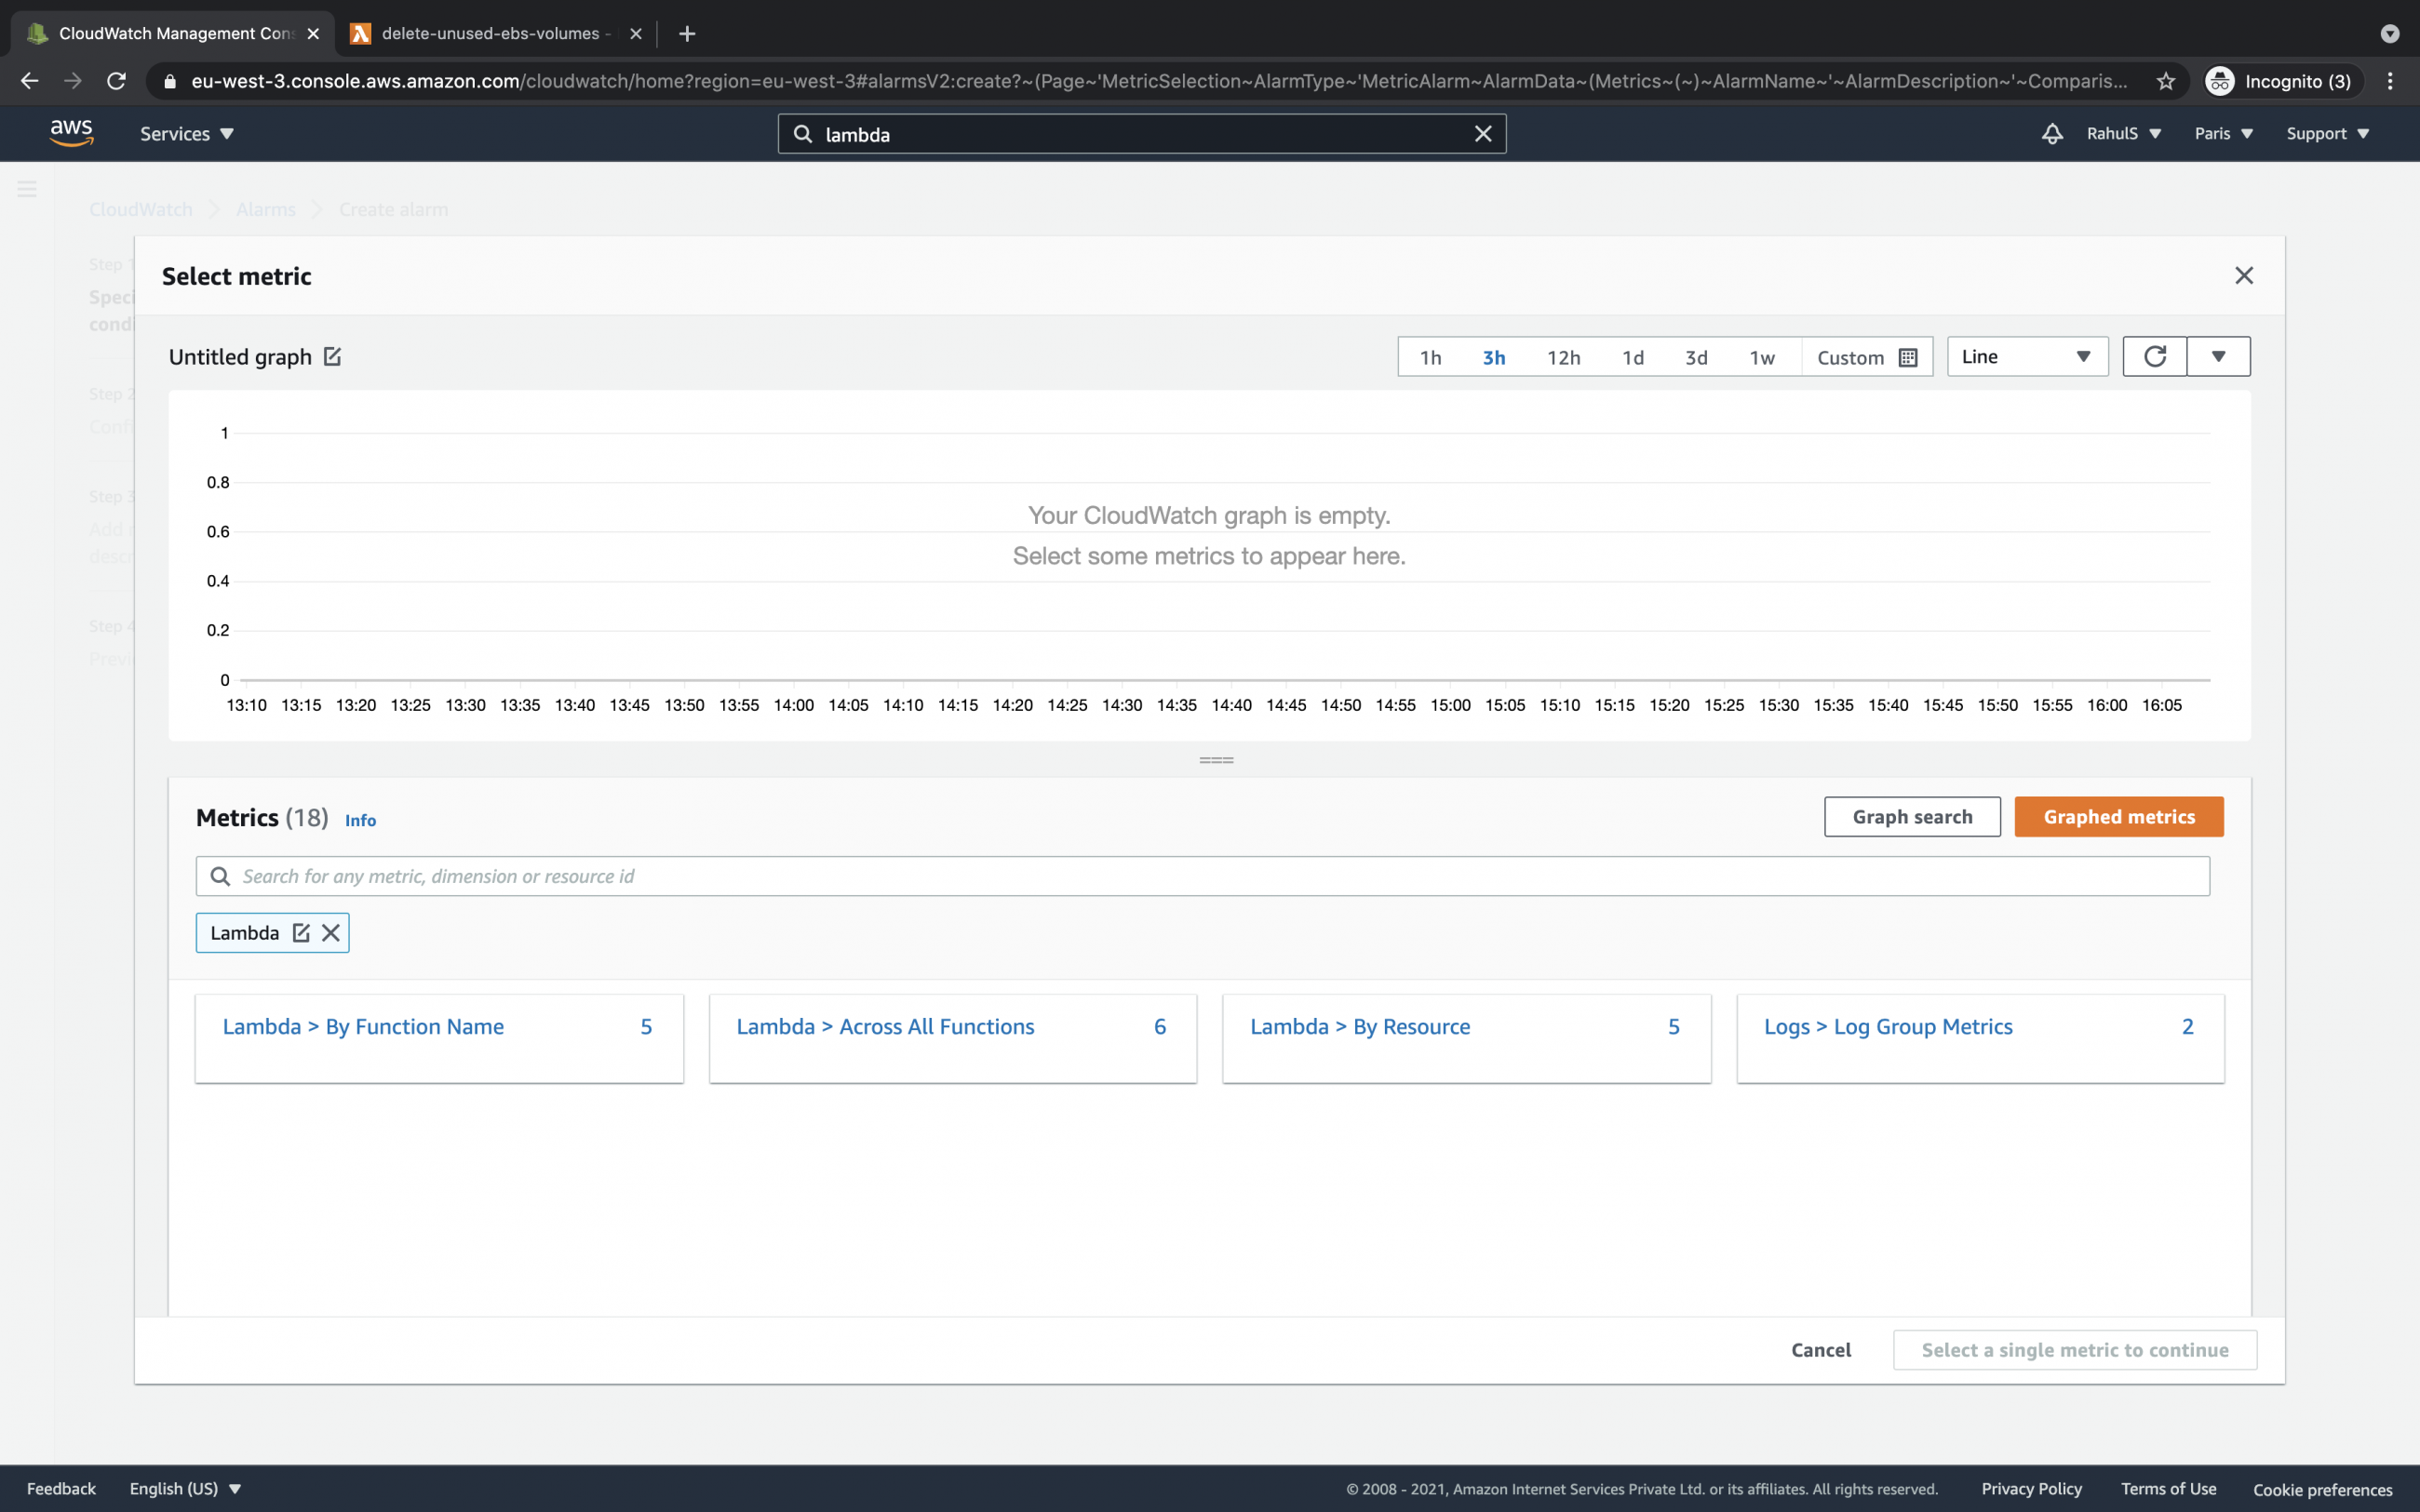
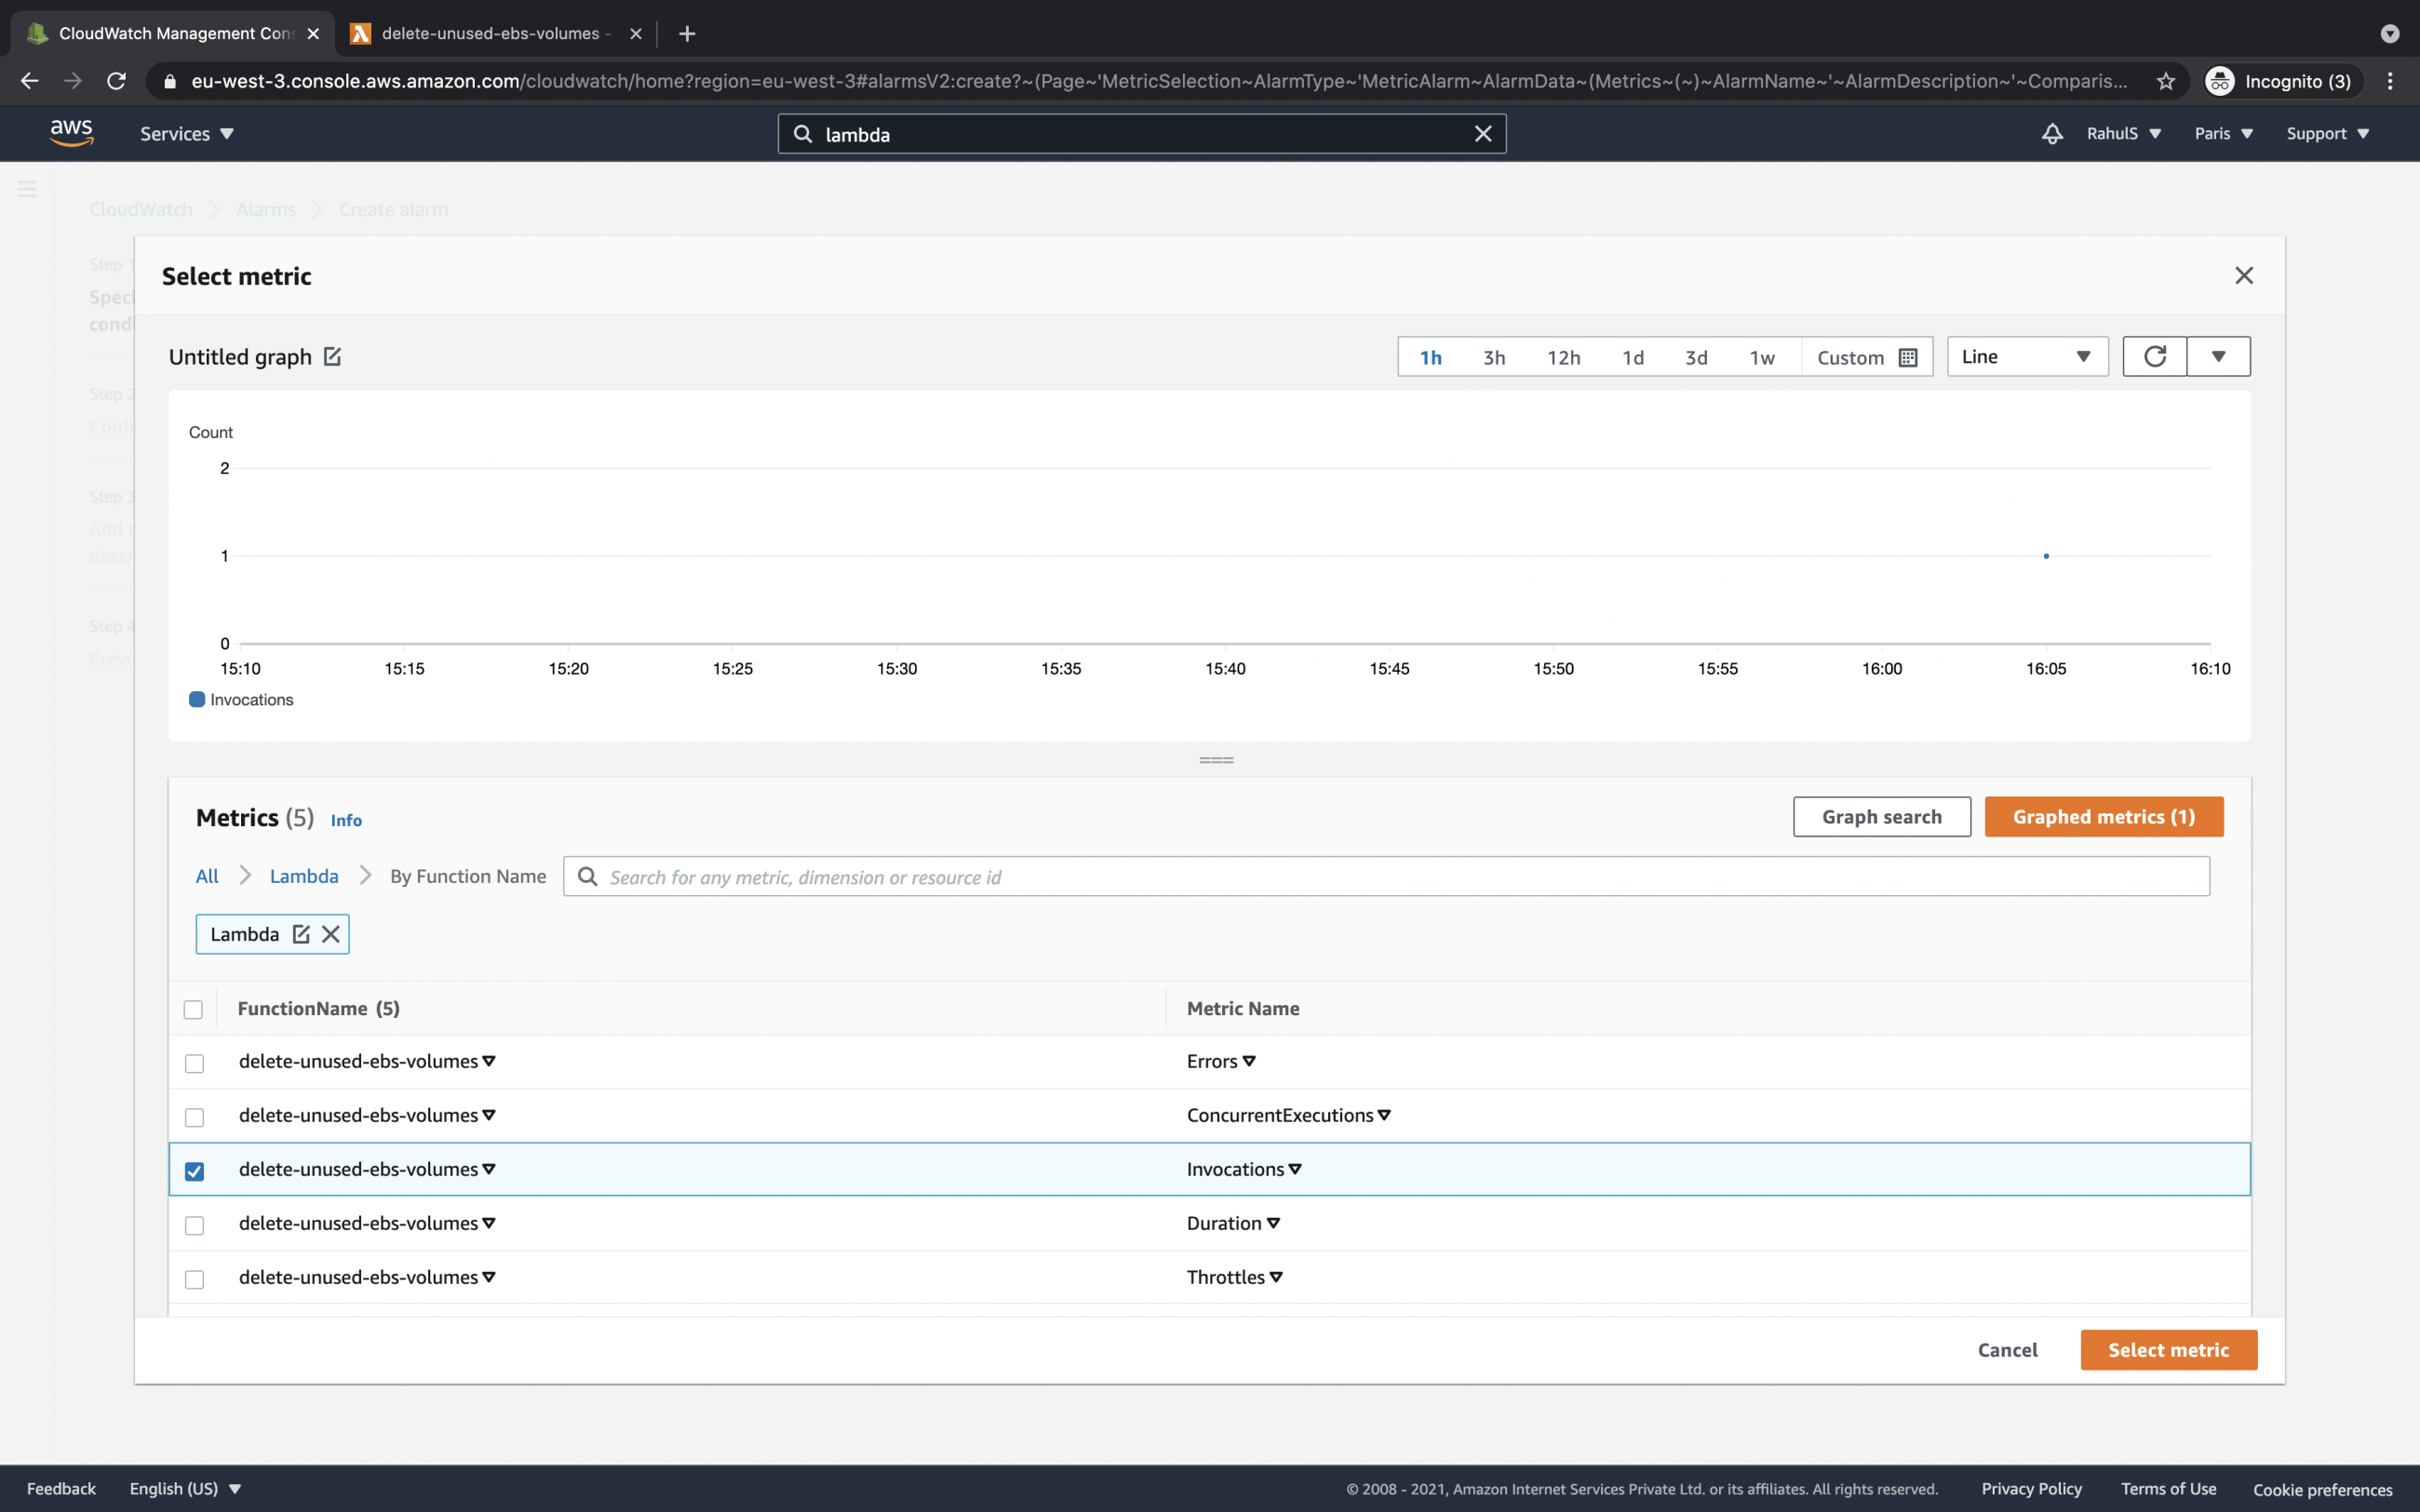
Filter the metrics by Lambda. Now you will see metrics available for Lambda functions. Click on "Lambda > By Function Name".
Select any one of the metrics available for the existing lambda functions. Here I will proceed with the "Invocations" metric. Click on the "Select metric" to proceed.
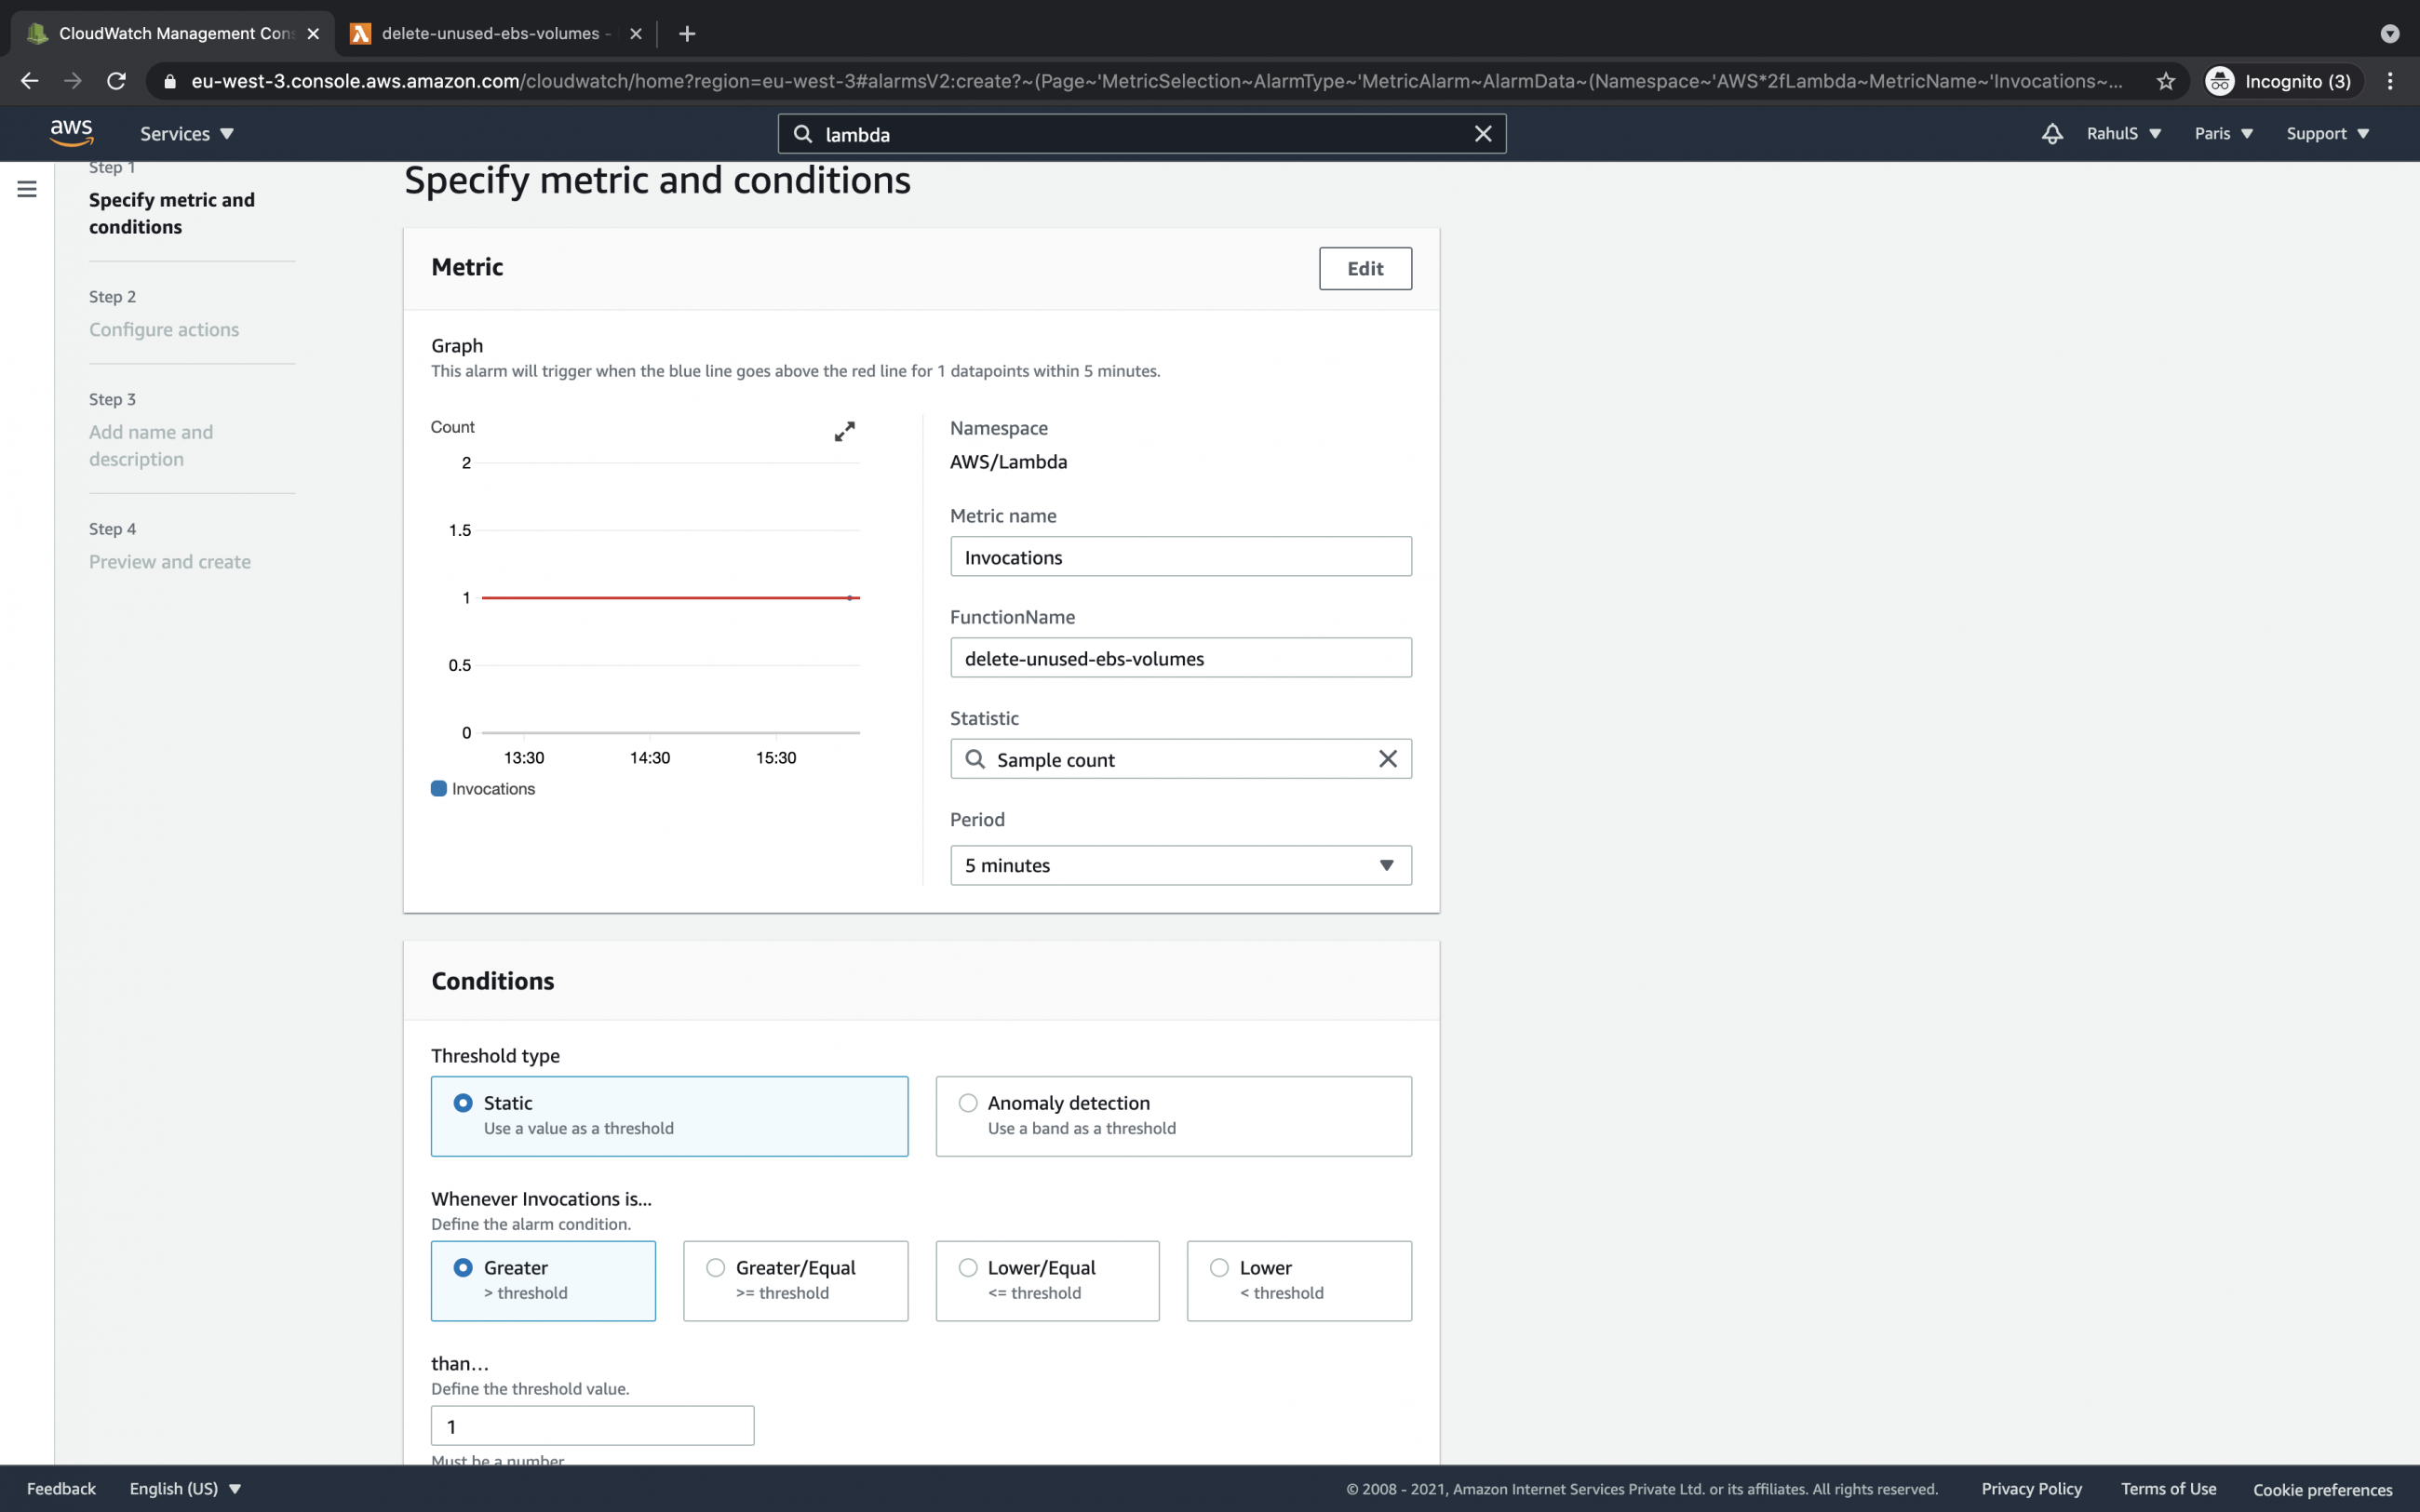
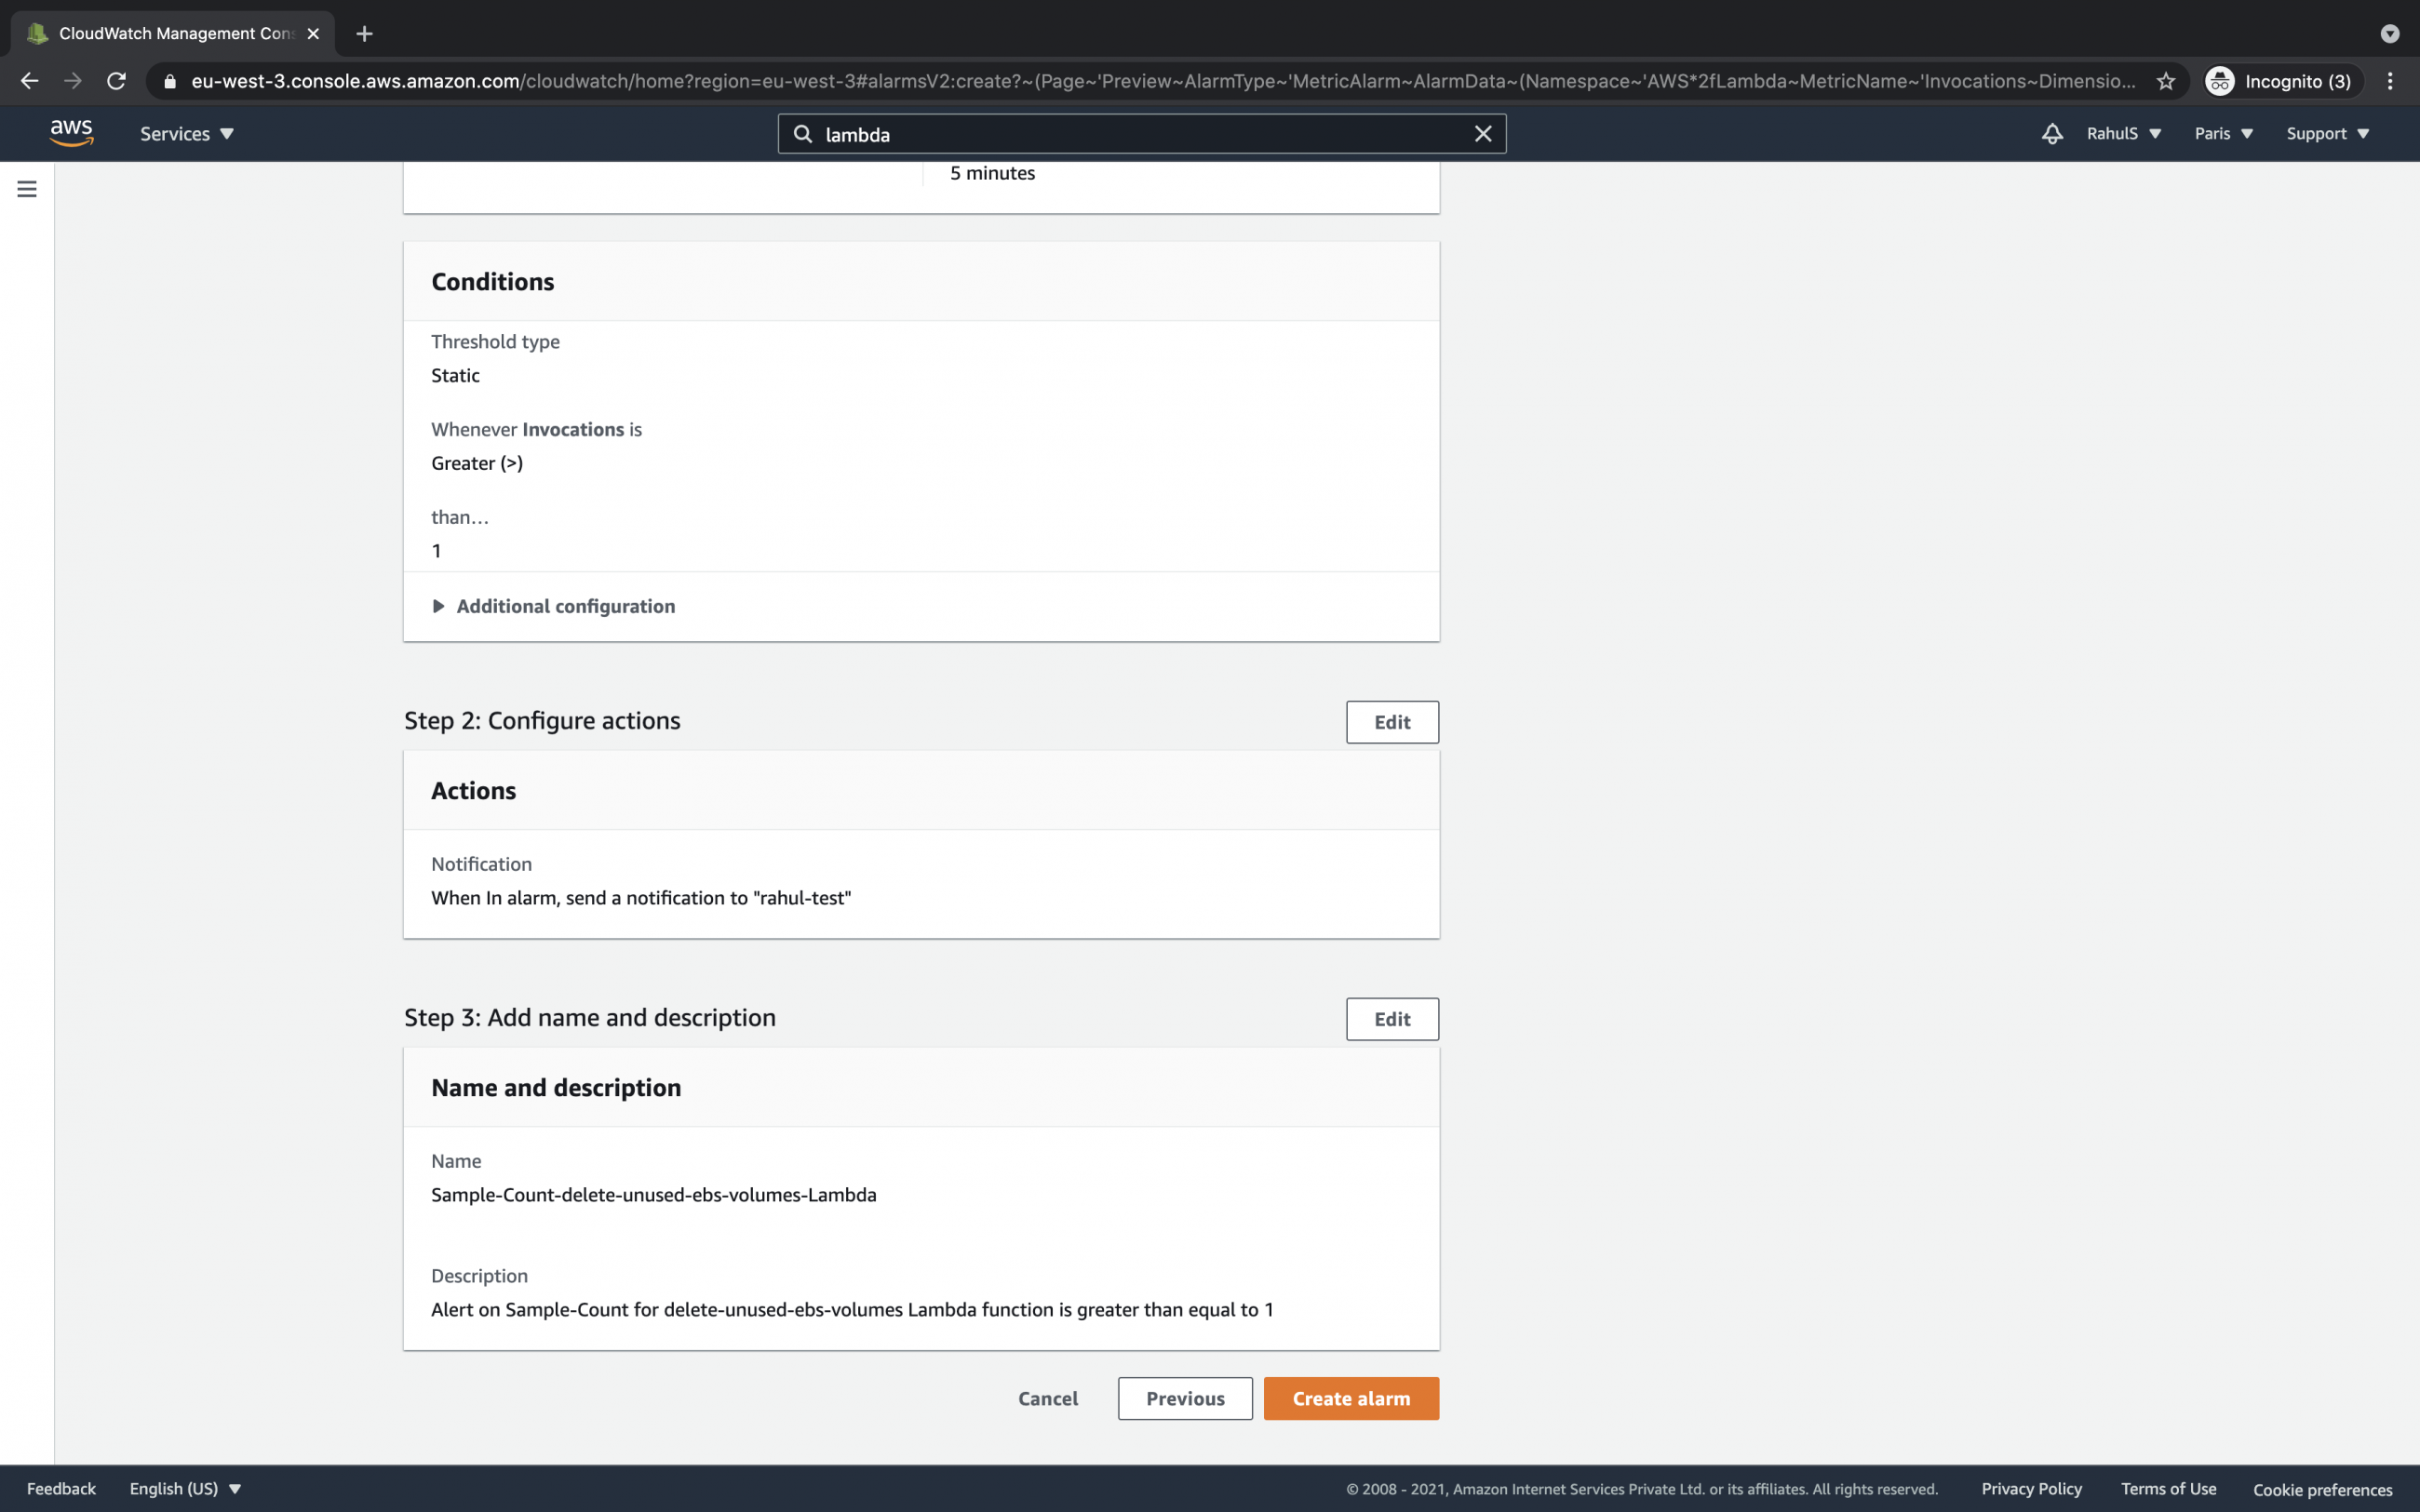
Choose Statistic, Threshold Type, Alarm Condition, and Threshold Value. Here, the alarm will be triggered if the Sample Count of the Invocations is greater than 1 for 5 minutes.
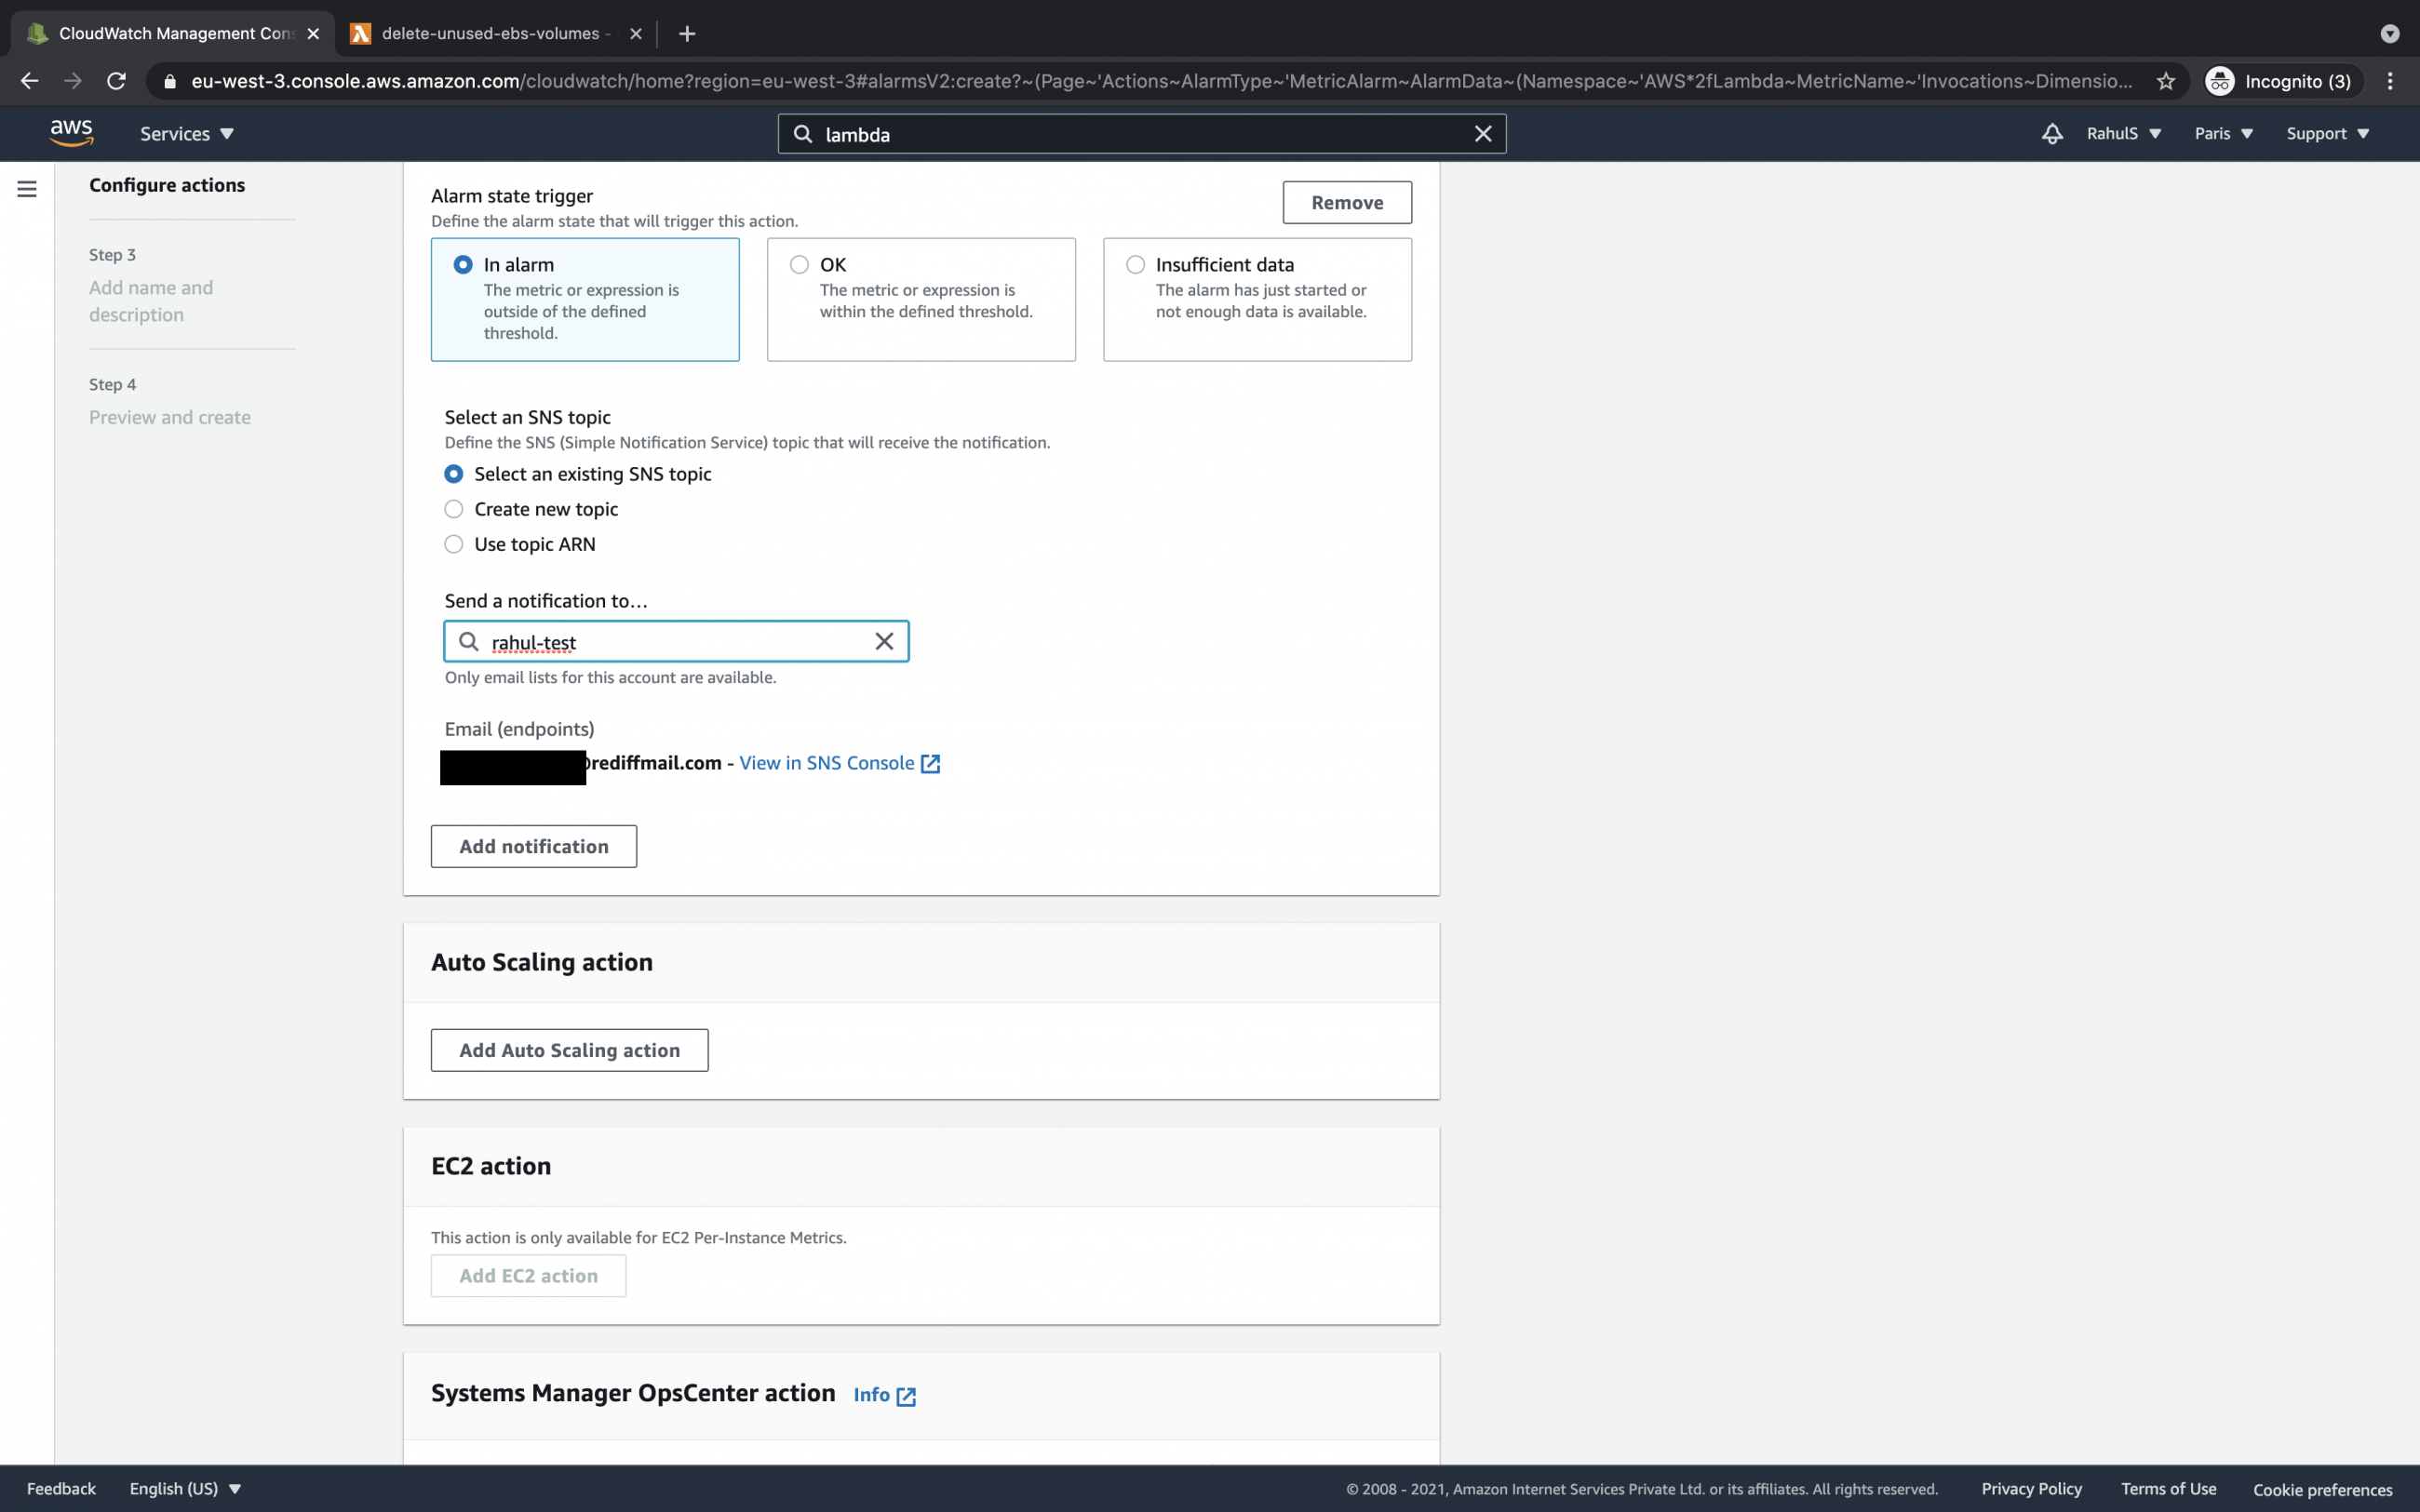
Choose the Alarm state trigger and the SNS topic. Here, the alarm will move to the "In alarm" state when triggered and send a notification to the specified SNS topic.
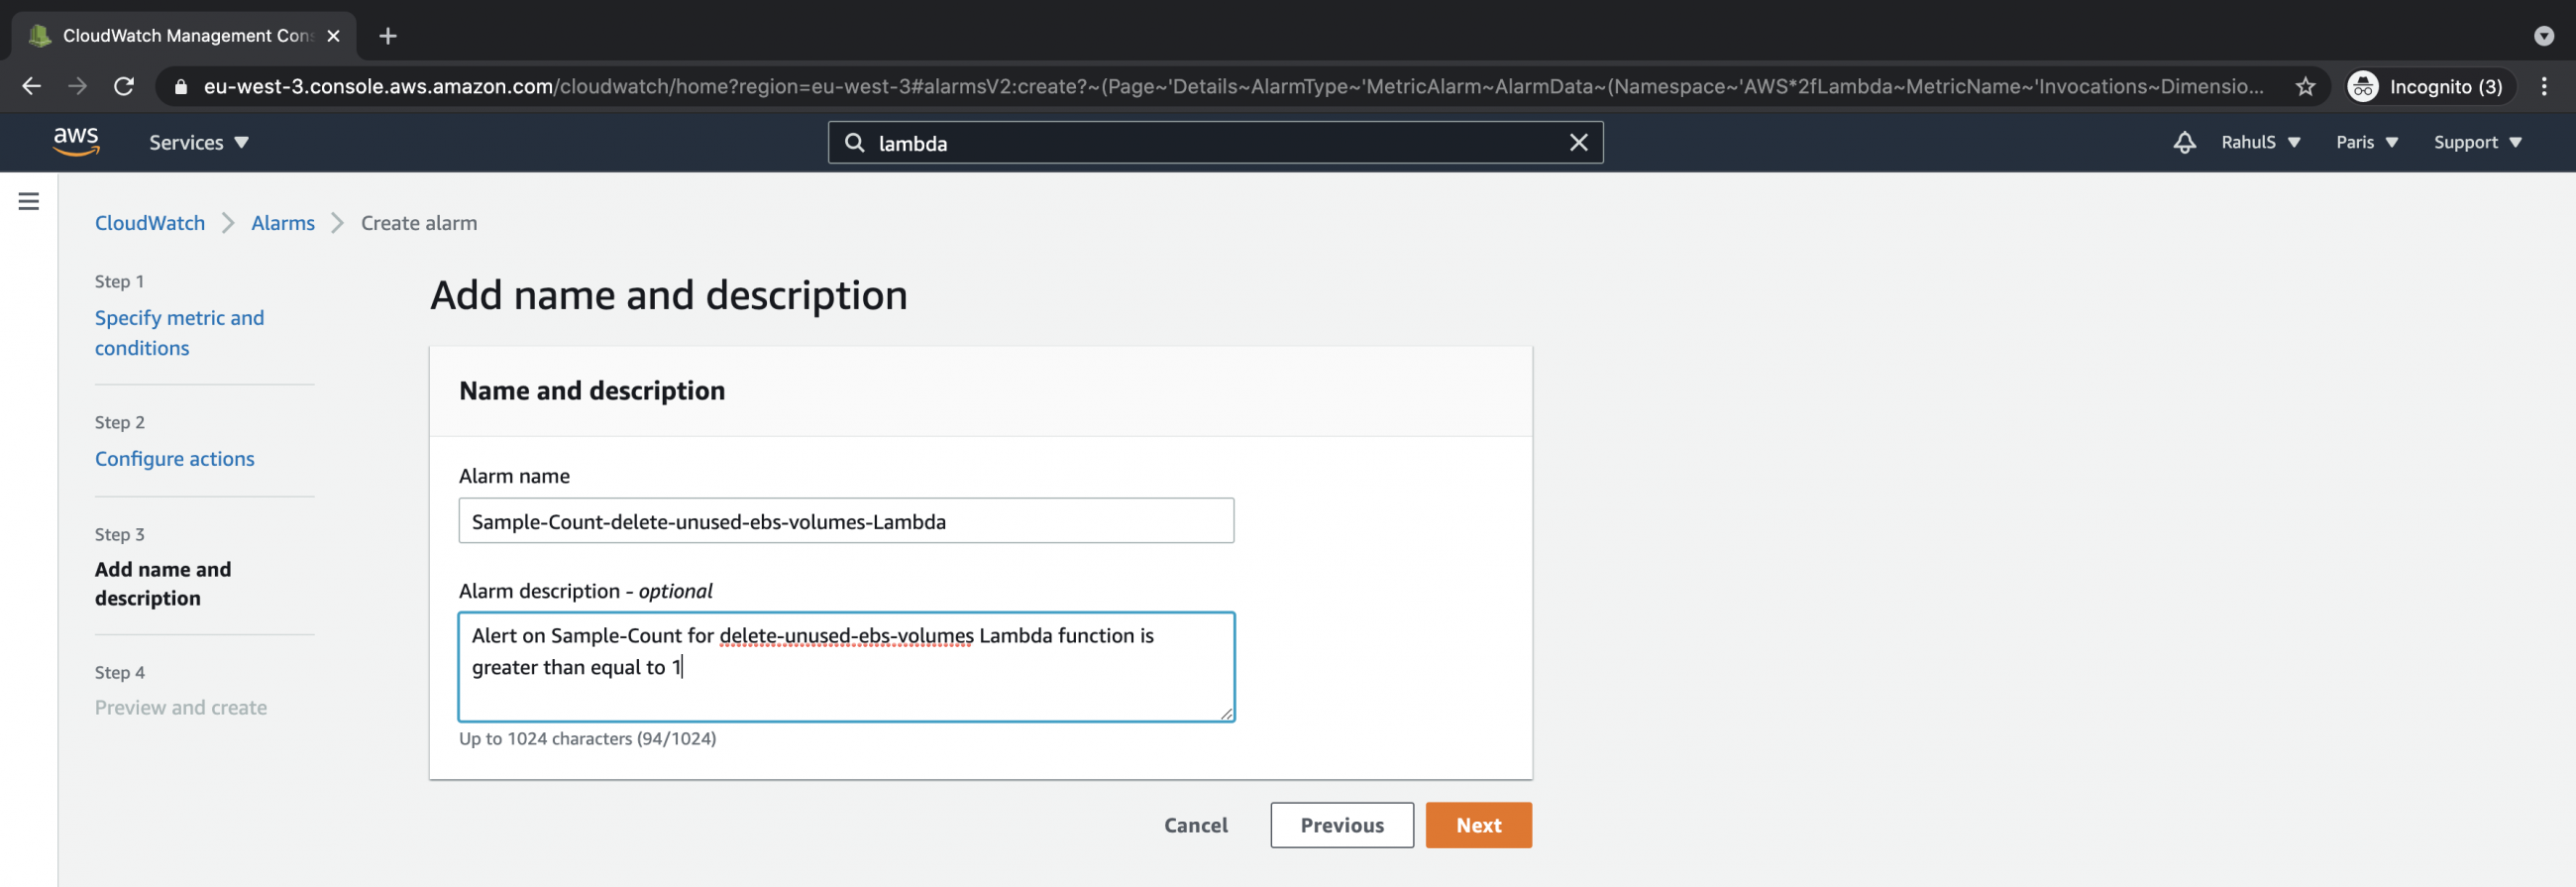
Add name and description to the alarm to be created and click on the "Next" button to proceed.
 \
\
Review all the configurations and click on the "Create alarm" button if everything looks fine.
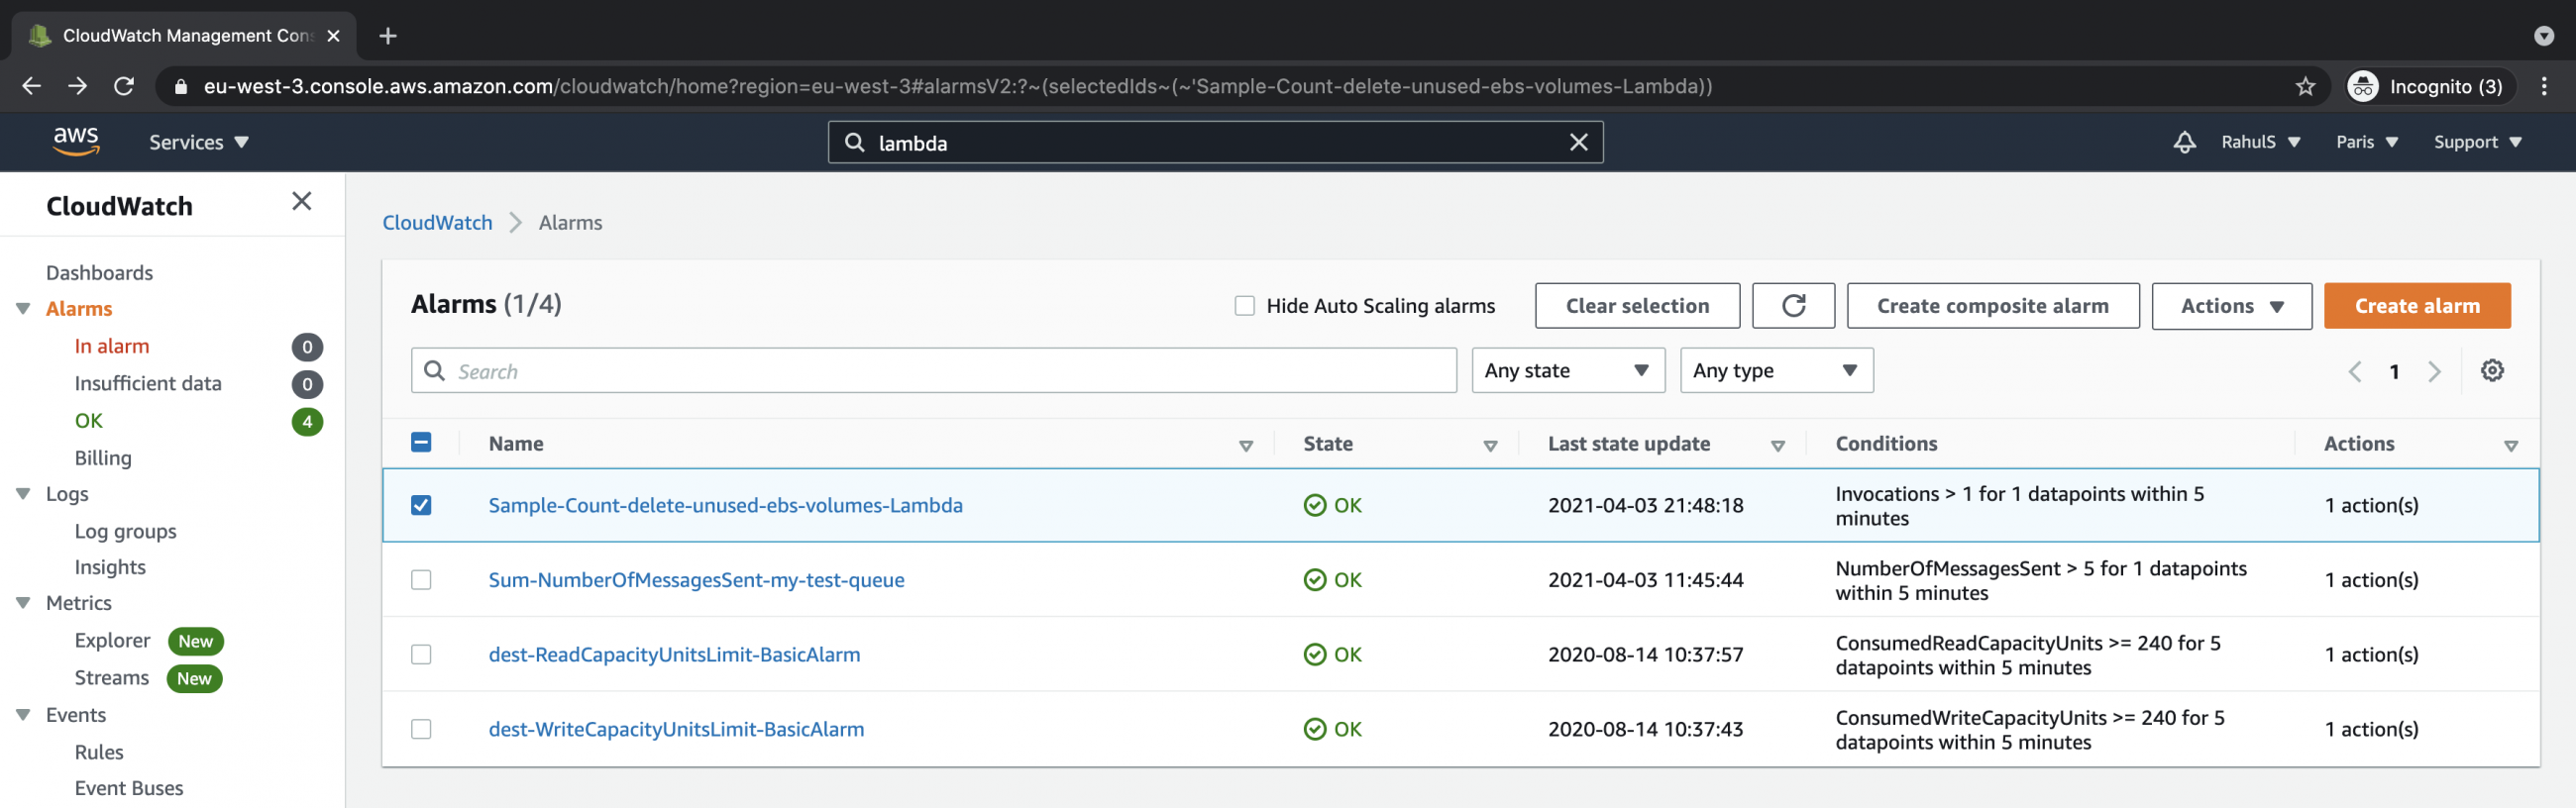
Once the alarm is created you can see it under the "Alarms" console. The state of the alarm will change based on the condition and threshold.
Conclusion
In this article, we created an alarm of the existing Lambda function to monitor the "Invocations" metric. The alarm we created gets triggered when "Sample count" is "Greater" than threshold "1" for "5 minutes" and sends a notification to the subscription in the SNS topic. You can now use the same steps to create alarms for different metrics, statistics, and thresholds.

